Wyoming Labor Force Trends
August 2026 | Volume 63, No. 8
Click Here for PDF
Return to Table of Contents
Tracking Wyoming’s Economy through Three Economic Downturns: A Sector-by-Sector Review
by: David Bullard, Senior Economist
Wyoming’s economy has been through three economic downturns since 1990. This article reviews these downturns through the perspective of seasonally adjusted employment at the total nonfarm level and in 13 different industry sectors. Employment followed different patterns during each downturn. Wyoming’s natural resources & mining sector has suffered some of the largest job losses in each of the three downturns. On the other hand, education & health services grew steadily through the first two downturns, and only lost jobs during the COVID-19 pandemic.
Wyoming's economy has had its ups and downs over the decades, including three economic downturns since 1990: first quarter 2009 to first quarter 2010 (2009Q1-2010Q1), second quarter 2015 to fourth quarter 2016 (2015Q2-2016Q4), and second quarter 2020 to first quarter 2021 (2020Q2-2021Q1; see Box below).
Each of these downturns has its own unique characteristics, and all three were preceded by declining energy prices. The first downturn was precipitated by the global financial crisis and is often called the Great Recession. The second downturn was not a national recession, but rather a downturn in the energy sector that affected Wyoming. The final downturn was the global COVID-19 pandemic.
This article reviews these downturns through the perspective of seasonally adjusted employment at the total nonfarm level and in 13 different industry sectors. Which sectors are most affected by economic downturns and suffer the steepest employment declines? Which sectors keep growing regardless of the state of the economy? This article provides answers by comparing peaks (period of highest employment) to troughs (period of lowest employment) during each downturn.
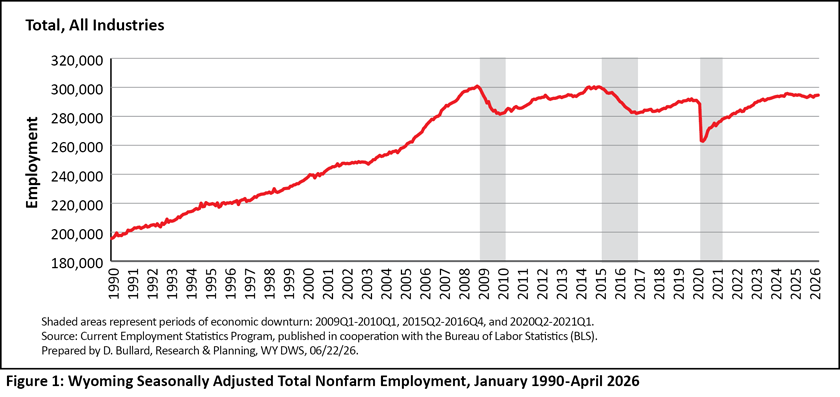
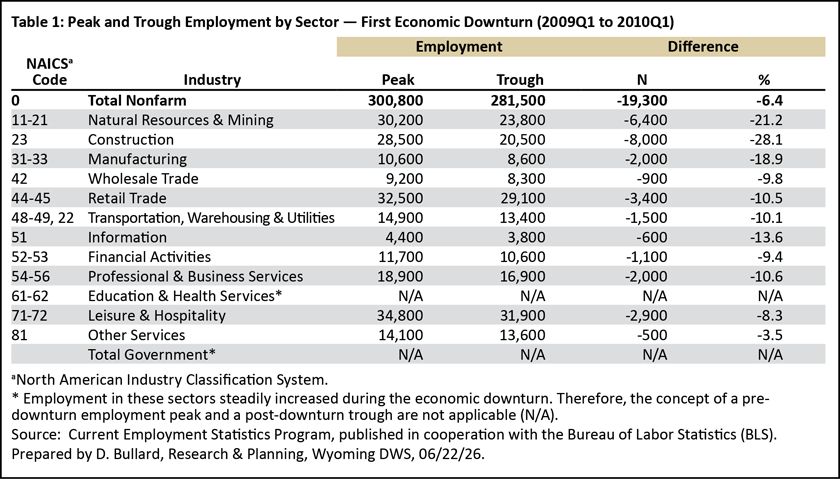
For example, total nonfarm employment peaked at 300,800 jobs in October 2008, which was three months before the start of the first downturn. Employment trended downward until hitting a low point of 281,500 jobs in December 2009. From peak to trough, total nonfarm employment fell by 19,300 jobs or, 6.4% during the first economic downturn (see Table 1).
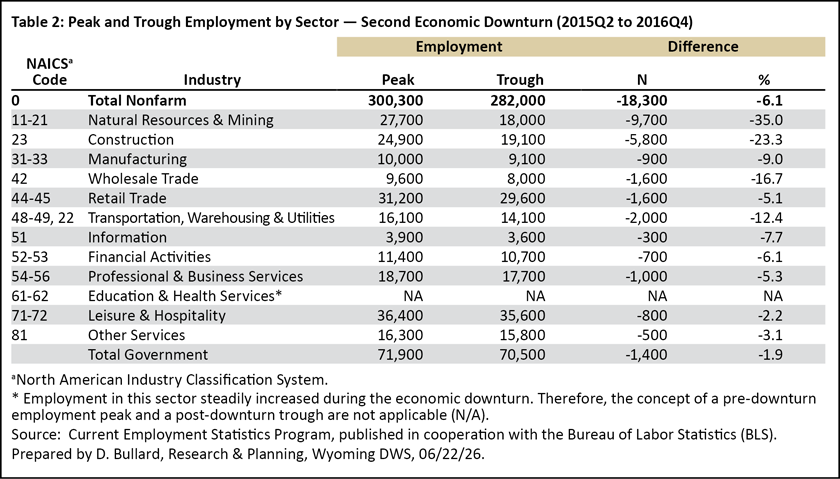
Total nonfarm employment then peaked at 300,300 jobs in January 2015 and fell to 282,000 jobs in December 2016 (see Table 2). The net loss of jobs in the second downturn was slightly smaller than in the first downturn (-6.1% compared to -6.4%).
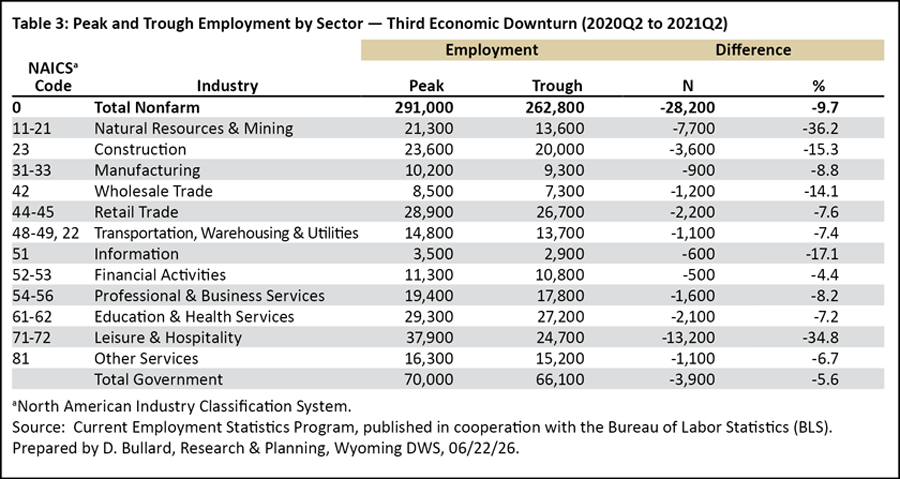
The Covid-19 pandemic, which was associated with the third economic downturn, caused the steepest decline in jobs, as employment fell from 291,000 in January 2020 to 262,800 in May 2020 (a decrease of 28,200 jobs, or -9.7%; see Table 3).
Table 1, Table 2, and Table 3 (shown below) are referred to throughout this article.
Figure 1 shows seasonally adjusted total nonfarm employment in Wyoming from January 1990 to April 2026. The three economic downturns are each individually highlighted.
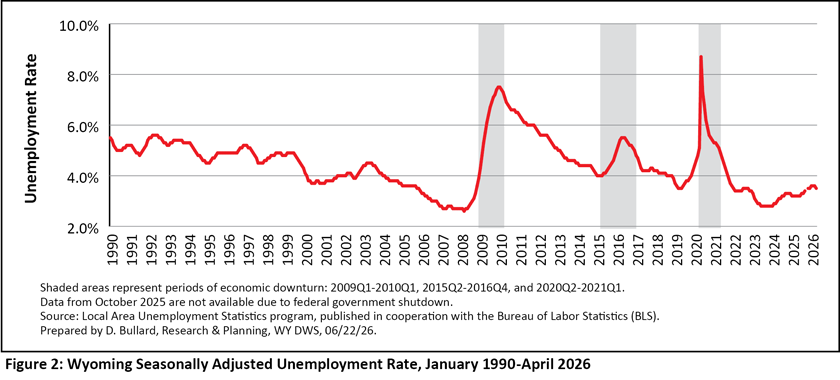
Wyoming’s unemployment rate started rising before the start of the first economic downturn (see Figure 2). Its low point occurred in March 2008 (2.6%) and it rose to a peak of 7.5% in December 2009. Unemployment fell slightly during the final two months of the downturn. During the second downturn, the unemployment rate rose from 4.0% in April 2015 to a peak of 5.5% in April 2016. Before the start of the pandemic, Wyoming’s unemployment rate hit a low point of 3.5% in May 2019 and then rose to 8.7% in May 2020.
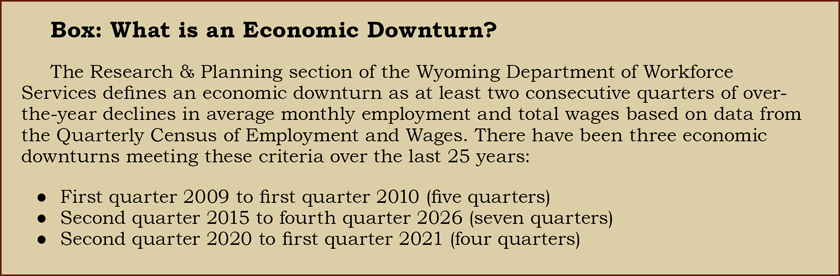
What is an Economic Downturn?
The Research & Planning section of the Wyoming Department of Workforce Services defines an economic downturn as at least two consecutive quarters of over-the-year declines in average monthly employment and total wages based on data from the Quarterly Census of Employment and Wages. There have been three economic downturns meeting these criteria over the last 25 years:
First quarter 2009 to first quarter 2010 (five quarters)
Second quarter 2015 to fourth quarter 2026 (seven quarters)
Second quarter 2020 to first quarter 2021 (four quarters)
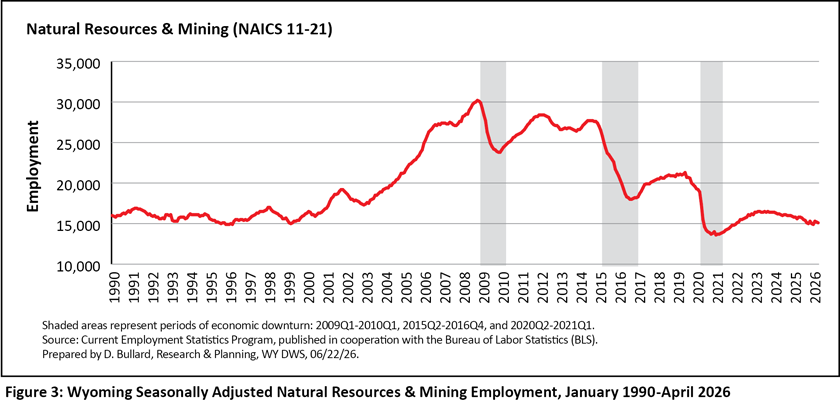
Figure 3 shows employment in Wyoming’s natural resources & mining sector. Employment hit a peak of 30,200 jobs in October 2008 and then fell to a low point of 23,800 jobs in December 2009. In just over a year, employment fell by 6,400 jobs, or 21.2%. In percentage terms, this was the second largest job loss of any sector in the first downturn.
During the second downturn, mining employment fell by an even larger 9,700 jobs, or 35.0%. This was the largest loss of jobs and the largest percentage decrease of any sector. During the second downturn, Wyoming saw large job losses in coal mining and in oil & gas employment.
Natural resources & mining employment also fell sharply during the COVID-19 pandemic. Job losses totaled 7,700, or 36.2%, which was the largest percentage loss of any sector.
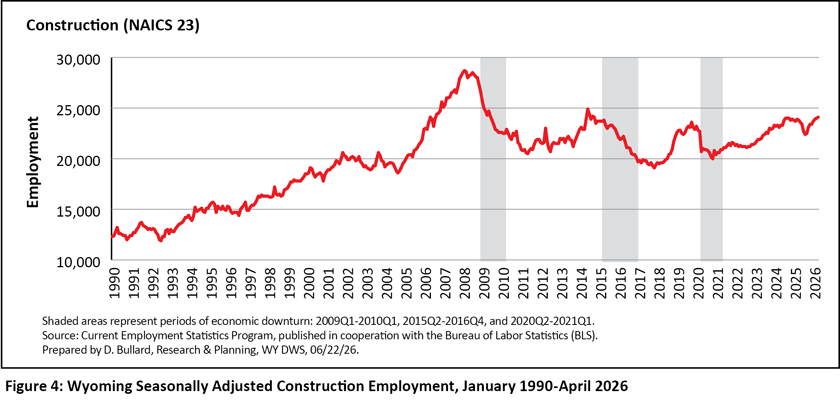
Employment in Wyoming’s construction sector peaked well before the first downturn started and employment continued to fall after the first downturn ended (see Figure 4). There was a net loss of 8,000 jobs (or 28.1%) from July 2008 to May 2011. This represented the largest job losses of any sector during the first downturn. Then, construction employment peaked at 24,900 jobs in June 2014 and fell to 19,100 jobs in November 2017. The 5,800 construction jobs lost during the second downturn were the second largest job losses of any sector. Construction job losses during the COVID-19 pandemic were considerably smaller, as employment fell from 23,600 jobs in October 2019 to 20,000 jobs in November 2020 (-3,600 jobs, or -15.3%).
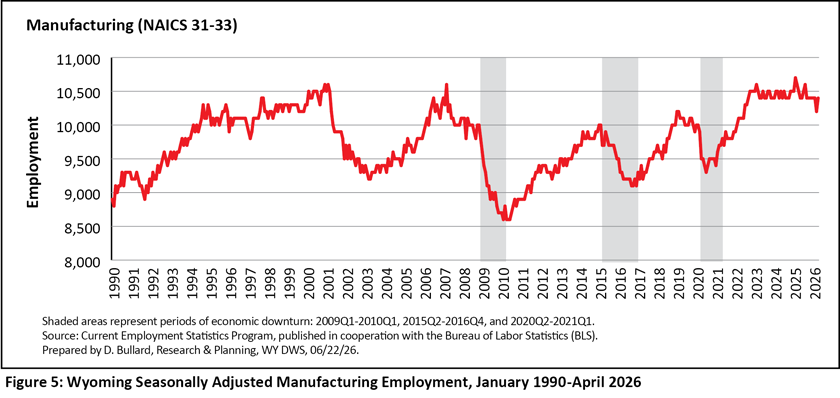
Wyoming’s manufacturing sector lost 2,000 jobs (or 18.9%) between its peak in March 2007 and its trough in February 2010 (see Figure 5 below, and Table 1). In percentage terms, this was the third largest employment decline in the first economic downturn. During the second economic downturn, manufacturing employment fell by 900 jobs, or 9.0%. Finally, during the third economic downturn, employment again fell by 900 jobs.
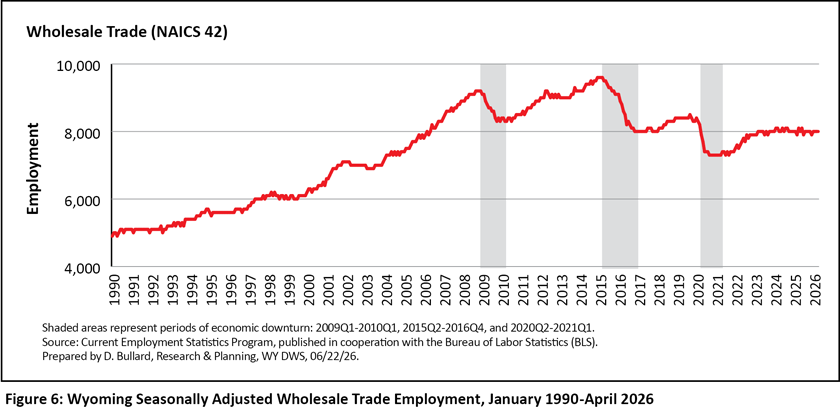
Figure 6 shows that the job losses in wholesale trade were fairly closely correlated with the first economic downturn. Employment peaked in December 2008, one month before the downturn started and then basically leveled-off in October 2009, with a net loss of 900 jobs (-9.8%). Wholesale trade employment fell by 1,600 jobs (-16.7%) during the second downturn and 1,200 jobs (-14.1%) during the third downturn.
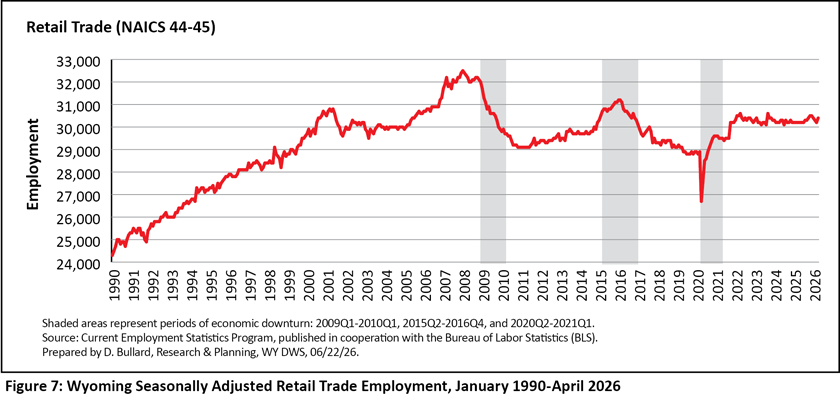
Wyoming’s retail trade sector includes many different types of stores, such as grocery stores, clothing stores, auto dealers, and department stores. In this sector, employment peaked in January 2008, well before the start of the first downturn and continued to fall for several months after the end of the downturn (see Figure 7). Retail employment fell by 3,400 jobs or 10.5%. This was the third largest job loss after construction and natural resources & mining (see Table 1).
Retail trade employment exhibited a somewhat strange pattern during the second economic downturn. Employment was rising when the second downturn started and continued to rise for several months, until hitting at peak of 31,200 jobs in January 2016. During the COVID-19 pandemic, retail employment fell from a peak of 28,900 jobs in March 2020 to a low point of 26,700 jobs in April 2020 and then grew rapidly.
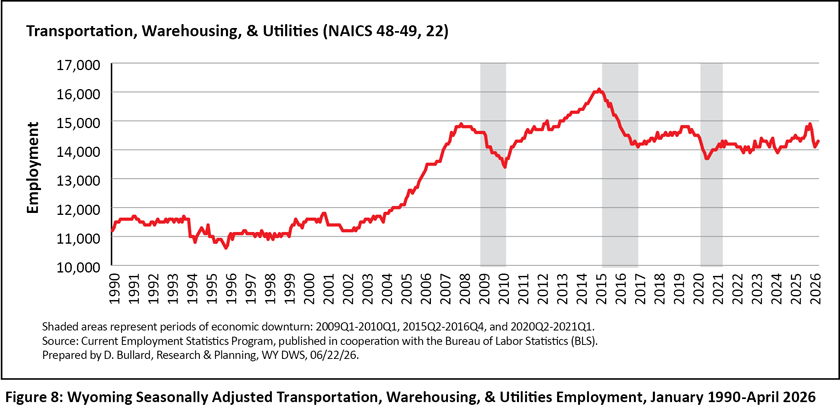
Figure 8 shows employment in Wyoming’s transportation, warehousing, & utilities sector. Employment peaked in December 2007, which was more than a year before the start of the first economic downturn. Then employment hit its low point in March 2010, which was the final month of the downturn. Overall, employment fell by 1,500 jobs, or 10.1%. During the second economic downturn, transportation, warehousing, & utilities lost 2,000 jobs (-12.4%; see Table 2), which was the third largest job loss of any sector. During the third downturn, or COVID-19 pandemic, employment fell by 1,100 jobs, or 7.4%.
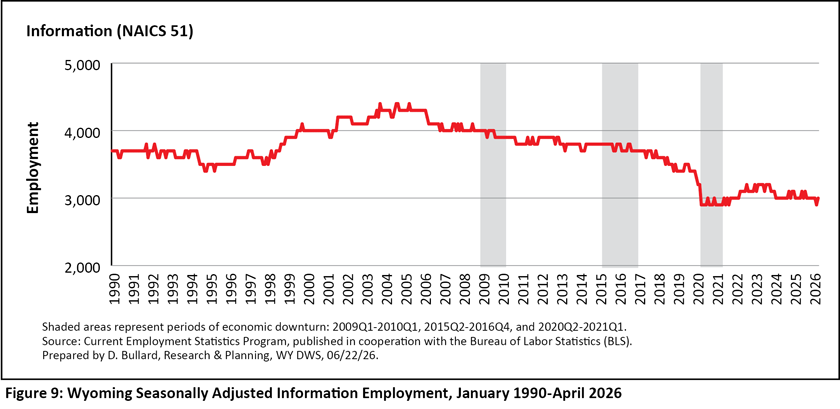
Employment in Wyoming’s information sector is shown in Figure 9. This sector’s employment seemed to be generally trending downward, regardless whether Wyoming’s economy was growing or not.
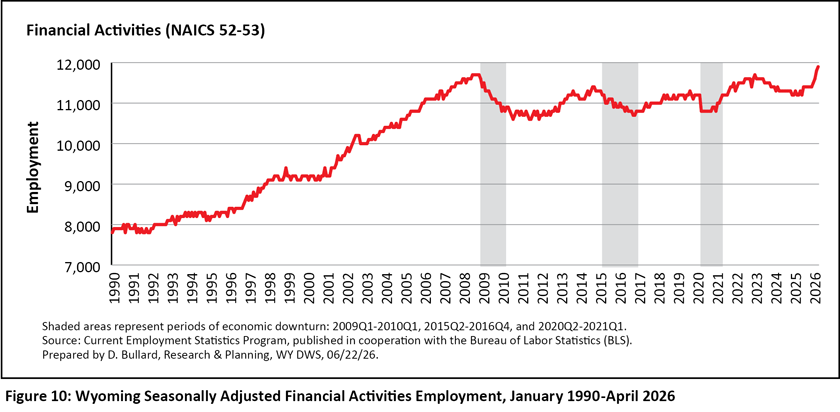
The financial activities sector includes banks, insurance companies, real estate agencies, and firms that rent and lease various equipment. Figure 10 shows that employment peaked in November 2008, just two months before the economic downturn began. This sector lost 1,100 jobs (-9.4%) during the first downturn. Job losses were smaller during the second downturn (-700 jobs, or -6.1%; see Table 2) and even smaller during the third downturn (-500 jobs, or, -4.4%; see Table 3).
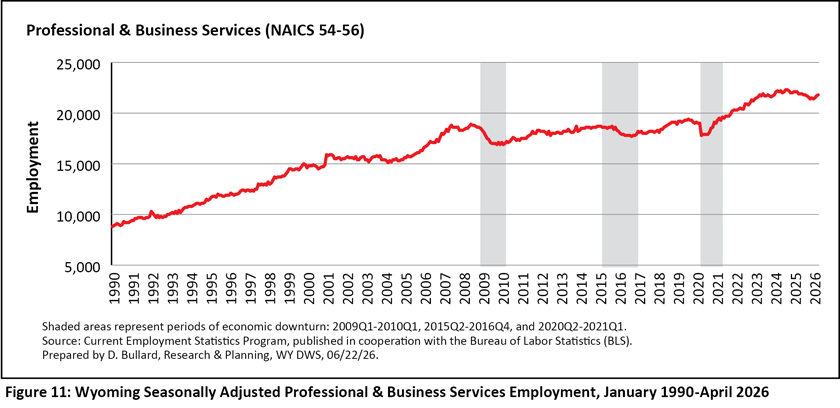
Employment in professional & business services is shown in Figure 11. From its peak in June 2008 to its trough in December 2009, this sector lost 2,000 jobs (-10.6%). Then, during the second economic downturn, employment only fell by 1,000 jobs (-5.3%). Professional & business services lost 1,600 jobs (-8.2%) during the COVID-19 pandemic.
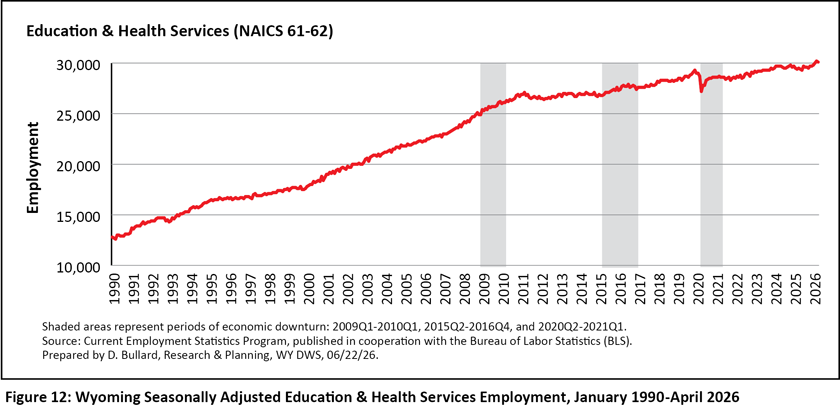
Education & health services employment generally trended upward during the first two downturns (see Figure 12). It was only during the COVID-19 pandemic that employment fell. This sector lost 2,100 jobs (-7.2%) between December 2019 and April 2020 (see Table 3). Education & health services truly stands out as a sector that has steadily gained jobs and mostly been unaffected by downturns.
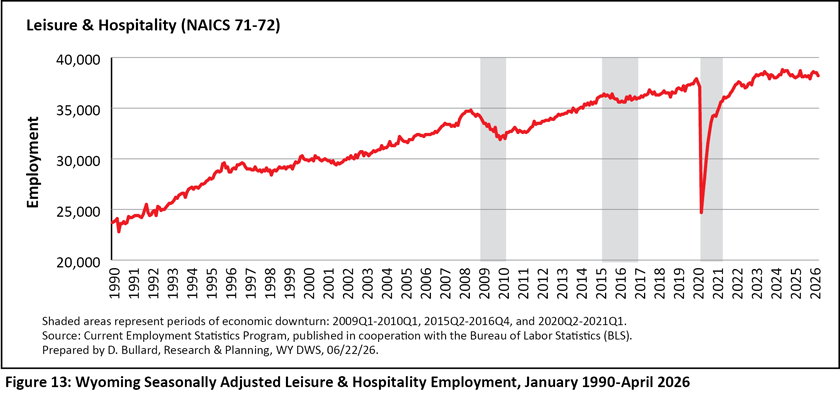
Figure 13 shows employment in the leisure & hospitality sector, which includes hotels, restaurants, bowling alleys, country clubs, and many other establishments. Employment peaked in June 2008, which was several months before the start of the first economic downturn. Employment hit a low point in December 2009 and started growing before the first downturn ended.
During the second downturn, leisure & hospitality employment only fell by 800 jobs (-2.2%), which was the second smallest percentage decrease of any sector (see Table 2). However, leisure & hospitality lost the most jobs of any sector during the COVID-19 pandemic (-13,200 jobs, or -34.8%). Employment peaked in January 2020 and then fell sharply until hitting a low point in April 2020.
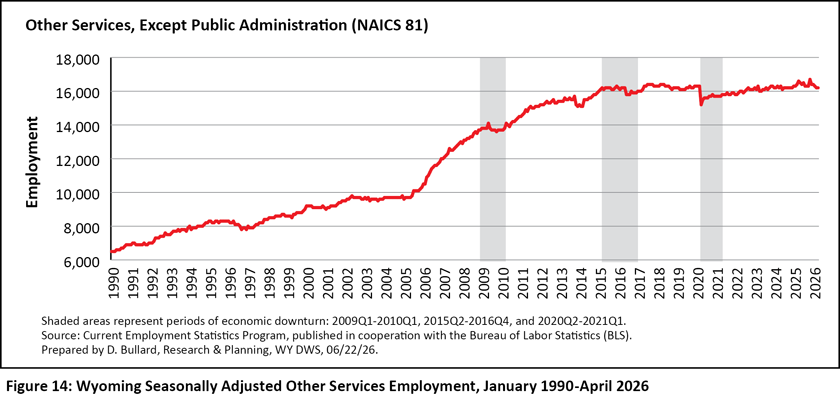
Funeral homes, hair salons, automotive repair services, and dry cleaners are some of the businesses included in the other services sector. Employment in this sector only fell by 500 jobs (-3.5%) during the first downturn and 500 jobs (-3.1%) during the second downturn (see Figure 14). However, it suffered through larger job losses during the third downturn, as employment fell by 1,100 jobs (-6.7%).
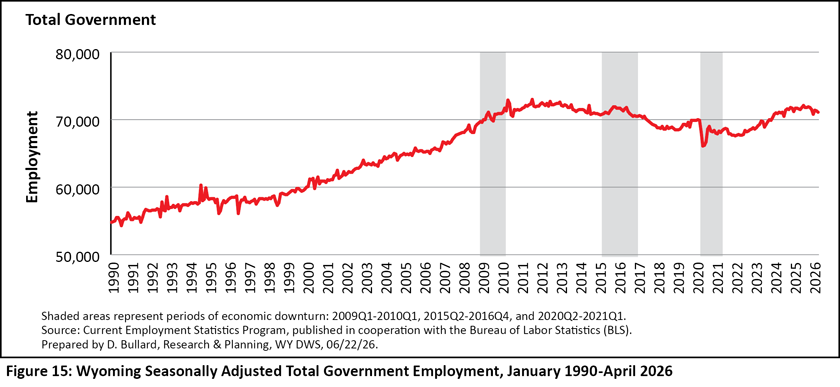
Total government employment is shown in Figure 15. This sector includes cities, towns, and counties, as well as public schools, colleges, and hospitals. All levels of government (federal, state, and local) are represented here. Government employment continued to grow during the first downturn, but fell during the second downturn (-1,400 jobs or -1.9%) and the third downturn (-3,900 jobs, or -5.6%).
Employment followed different patterns during each downturn. During the first downturn (or Great Recession), the largest job losses, both in absolute and percentage terms were in construction and natural resources & mining. In contrast, education & health services, and government both continued to add jobs during the first downturn.
In the second downturn, which primarily affected the energy sector, the largest job losses were in natural resources & mining, and construction. Smaller, but still substantial job losses occurred in transportation, warehousing & utilities, wholesale trade, and retail trade.
During the COVID-19 pandemic, or the third downturn, sizeable job losses occurred in leisure & hospitality, natural resources & mining, and government.
In summary, Wyoming’s natural resources & mining sector has suffered some of the largest job losses in each of the three different economic downturns. On the other hand, education & health services grew steadily through the first two downturns, and only lost jobs during the COVID-19 pandemic.
Reference
Moore, M. (2025, December). 2025Q1 quarterly update: Wyoming job growth slows from prior quarters. Wyoming Labor Force Trends, 62(12). Research & Planning, WY DWS. Retrieved June 15, 2026, from https://doe.state.wy.us/LMI/trends/1225/1225.pdf

 Hire Wyo