Wyoming Labor Force Trends
April 2024 | Volume 61, No. 4
Click Here for PDF
Return to Table of Contents
2023Q3 Quarterly Update: Job Growth Continues for 10th Consecutive Quarter
by: Michael Moore, Research Supervisor
This article provides an overview of Wyoming’s employment and wages in third quarter 2023. Job growth was seen in most industries, with the largest job growth in construction. Especially strong growth was observed in power & communication system construction (including the construction of wind farms). Employment increases occurred in 18 of Wyoming's 23 counties.
Wyoming added more than 6,200 jobs and $186.4 million in total wages over the year in third quarter 2023 (2023Q3; see Table 1). This marked the 10th consecutive quarter of over-the-year job growth. Average monthly employment was also slightly higher (1,349, or 0.5%) compared to 2019Q3 prior to the pandemic.
This article looks at quarterly employment and wages at the county and industry levels for 2023Q3, in order to determine areas of over-the-year job growth.
The data discussed in this article are from the Quarterly Census of Employment and Wages (QCEW). Data from 2023Q3 are available at https://doe.state.wy.us/LMI/23Q3_QCEW/toc.htm.
Introduction
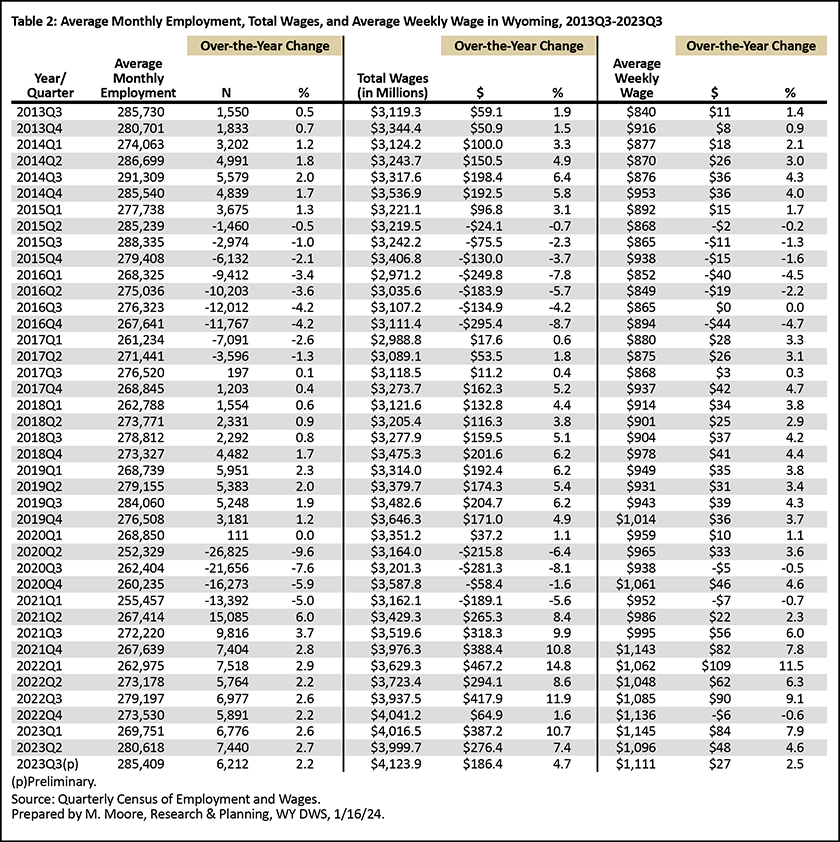
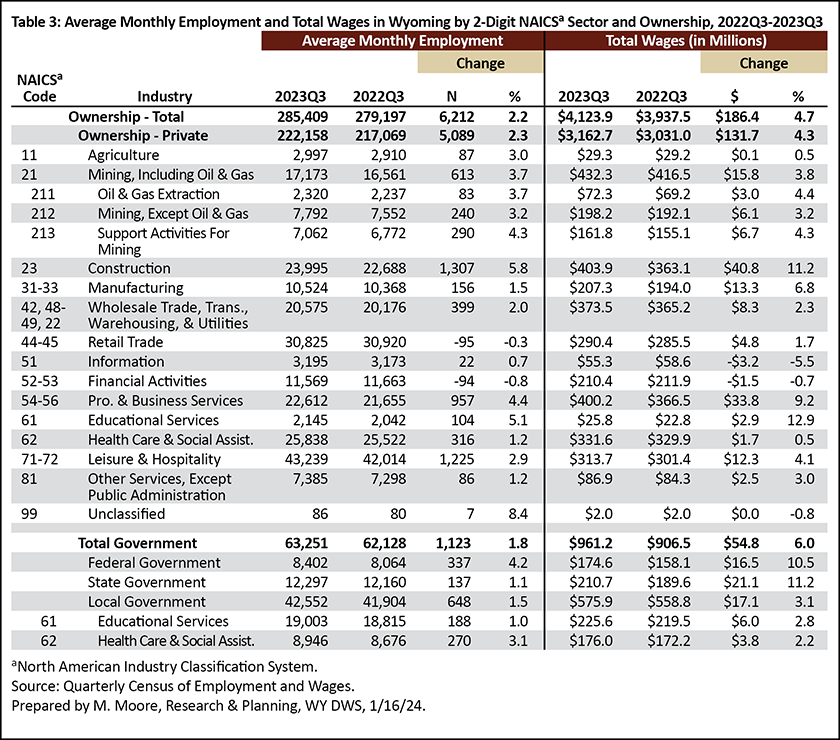
Wyoming’s average monthly employment in 2023Q3 was 285,409, an increase of 6,212 jobs (2.2%) compared to 2022Q3 (see Table 2). The state had $4.1 billion in total wages, up $186.4 million (4.7%) over the year. Wyoming's average weekly wage increased from $1,085 to $1,111 ($27, or 2.5%).
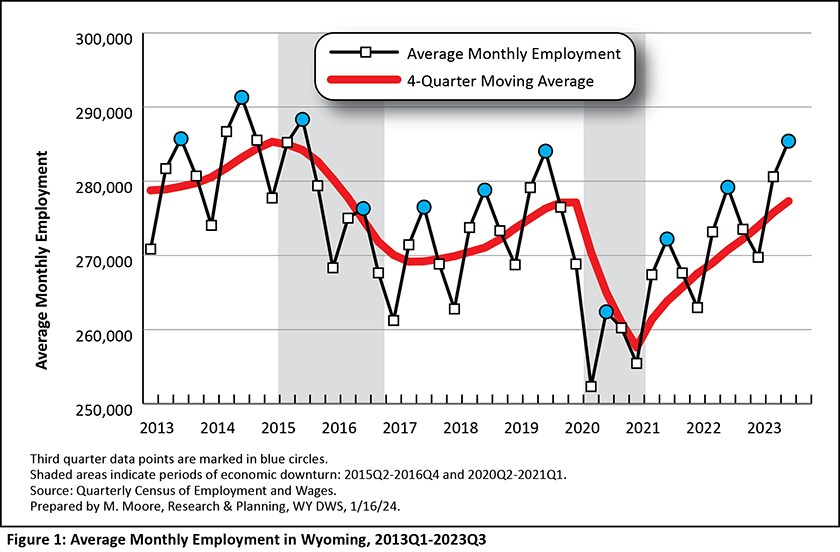
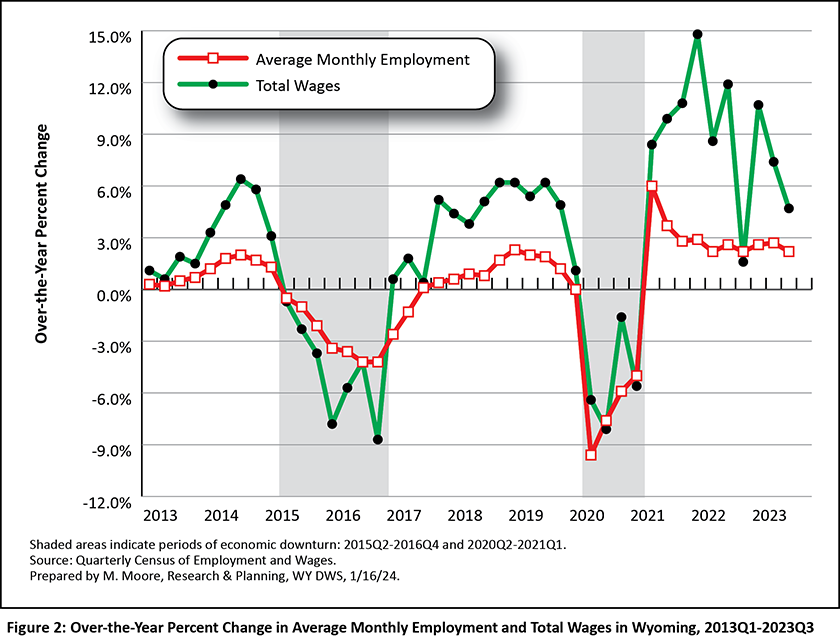
Wyoming employment typically increases from first quarter to second, before peaking in third quarter (see Figure 1). The shaded areas in the figures in this article represent periods of economic downturn. The Research & Planning (R&P) section of the Wyoming Department of Workforce Services has defined an economic downturn as a period of at least two consecutive quarters of over-the-year decreases in average monthly employment and total wages based on data from the QCEW. Wyoming has endured three such economic downturns since 2009: 2009Q1 to 2010Q1, 2015Q2 to 2016Q4, and 2020Q2 to 2021Q1 (see Figure 2). Wyoming’s most recent downturn was influenced by the COVID-19 pandemic and declines in the prices of and demand for the state’s energy resources. While each downturn had its own unique circumstances, declining energy prices preceded all three (Moore, 2019).
As illustrated in Figure 1, Wyoming's average monthly employment fell to a decade low of 252,329 during 2020Q2 at the start of the pandemic. From 2020Q3 to 2023Q3, employment increased by 23,005 jobs, or 8.8%. Also, 2023Q3 marked the third consecutive quarter of Wyoming returning to or exceeding pre-pandemic employment levels. As previously mentioned, the state's average monthly employment increased by 1,349 jobs (0.5%) compared to 2019Q3.
Industry
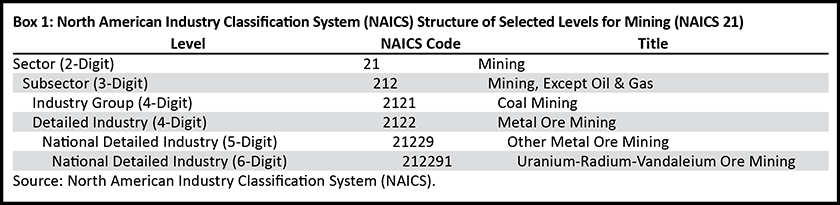
Industries are organized by the North American Industry Classification System (NAICS). A sample of the NAICS hierarchal structure for mining (NAICS 21) can be found in Box 1. This section of the article discusses statewide employment at the sector (or two-digit NAICS) level.
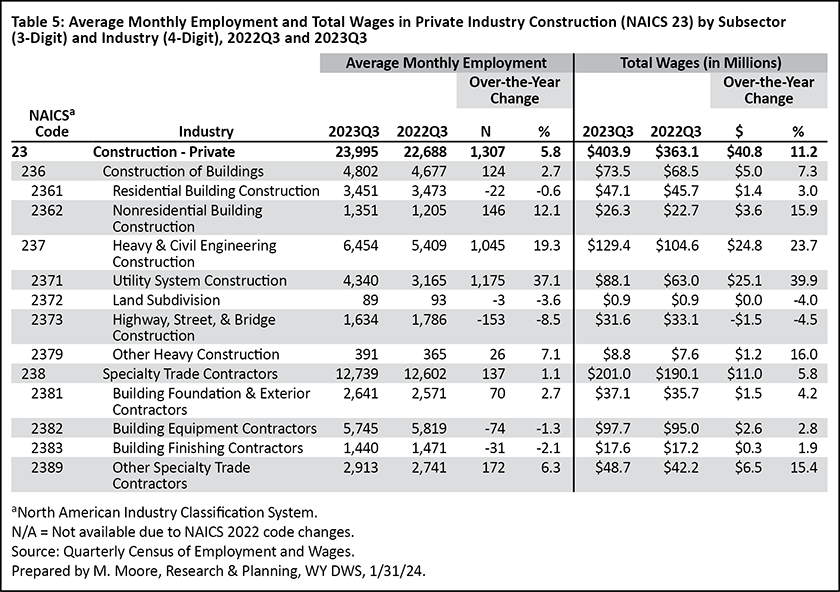
As shown in Table 3, substantial over-the-year job growth occurred in several industries, led by construction (1,307 new jobs, or 5.8%), leisure & hospitality (1,225, or 2.9%), professional & business services (957, or 4.4%), and mining, including oil & gas (613, or 3.7%). This article provides detailed employment and wage information on these four sectors. Historical industry-level data from 2001Q1 to 2023Q3 discussed in this article are available at https://doe.state.wy.us/LMI/QCEW_OTY/toc.htm.
The only industries with over-the-year job losses in 2023Q3 were retail trade (-95, or -0.3%) and financial activities (-94, or -0.8%). Total government increased by 1,123 jobs (1.8%), with the greatest increase seen in local government (648, or 1.5%).
Wyoming's total wages increased from $3.9 billion in 2022Q3 to $4.1 billion in 2023Q3 ($186.4 million, or 4.7%). In Wyoming's private sector, the greatest increases in total wages were seen in construction ($40.8 million, or 11.2%), professional & business services ($33.8 million, or 9.2%), and mining, including oil & gas ($15.8 million, or 3.8%). Total government wages increased by $54.8 million, or 6.0%.
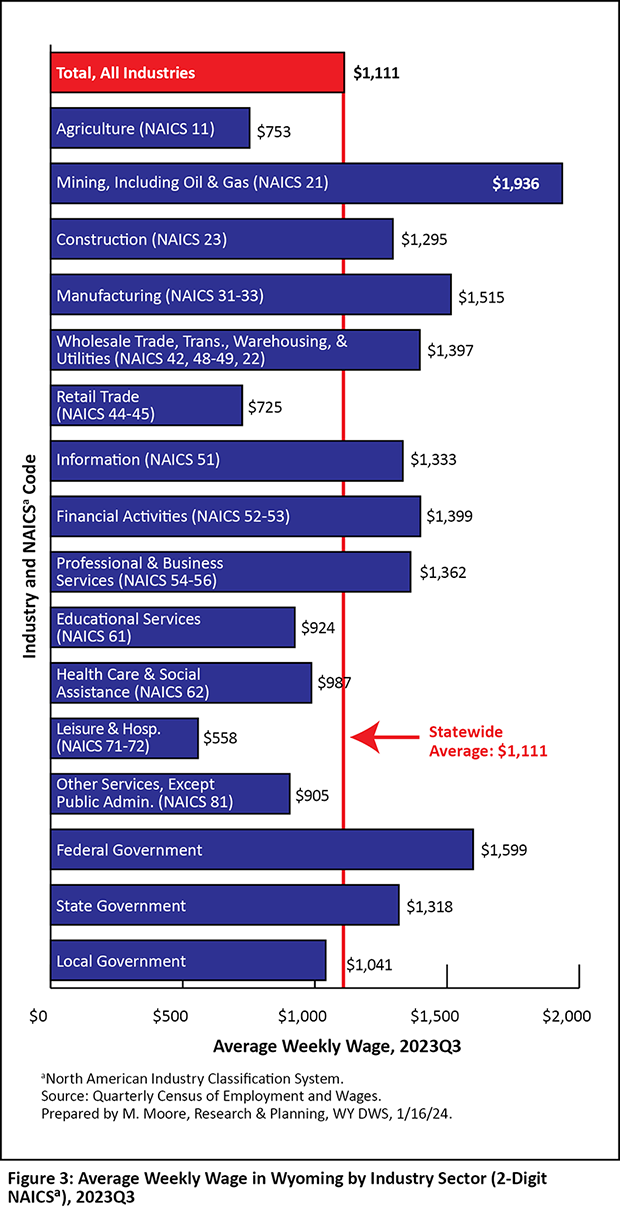
Across all industries, Wyoming's average weekly wage in 2023Q3 was $1,111 (see Figure 3). The industries with the highest weekly wages were mining, including oil & gas ($1,936), federal government ($1,599), manufacturing ($1,515), and financial activities ($1,399). The industries with the lowest average weekly wages were leisure & hospitality ($558), retail trade ($725), and agriculture ($753).
Mining, Including Oil & Gas (NAICS 21)
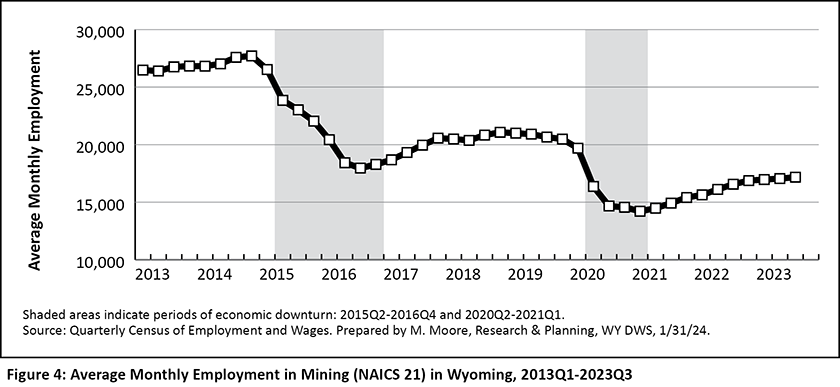
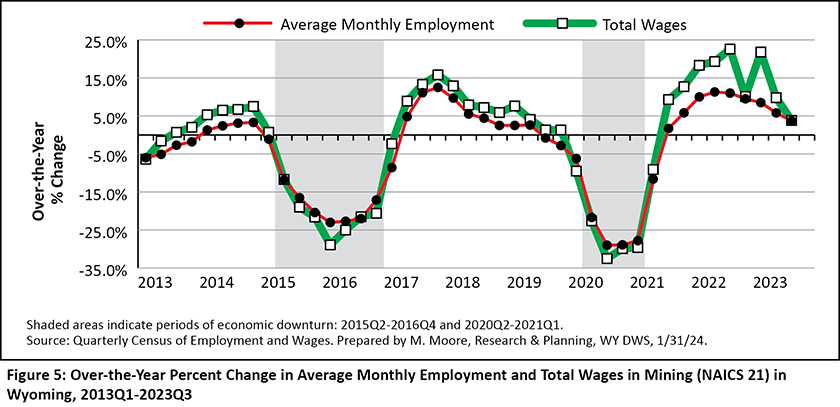
Employment has increased in Wyoming's mining (including oil & gas) sector over the last two years, but it has not returned to pre-pandemic levels. As illustrated in Figure 4 and Figure 5, average monthly employment and total wages increased from prior-year levels for nine consecutive quarters beginning in 2021Q3. However, there were nearly 3,500 fewer jobs (-16.9%) in 2023Q3 compared to 2019Q3 prior to the pandemic. During the last 10 years, the highest average monthly employment in mining was 27,708 in 2014Q4, or 10,535 more jobs compared to 2023Q3.
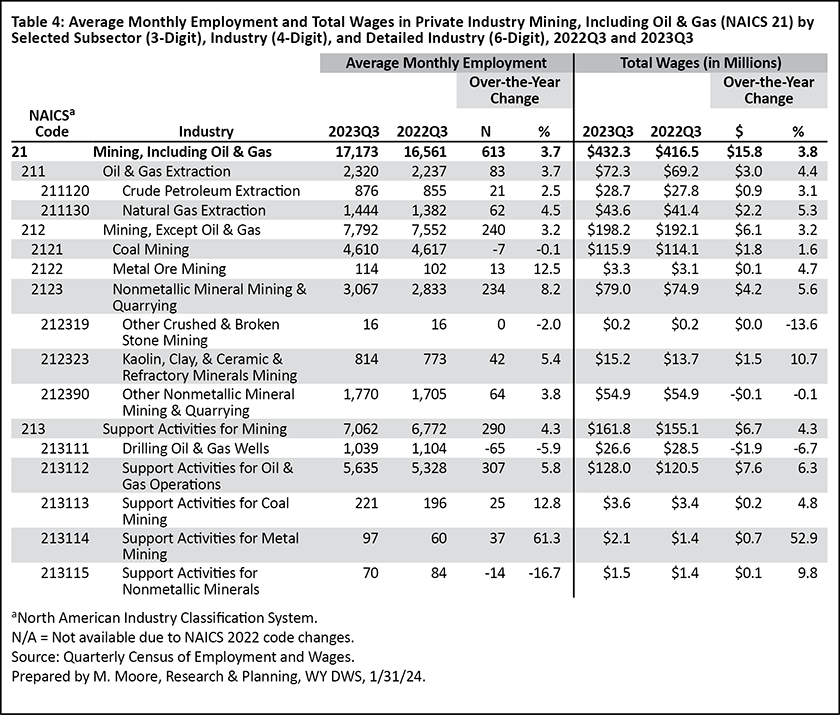
Detailed employment and wage information for selected subsectors (three-digit), industries (four-digit), and detailed industries (six-digit) in Wyoming's mining sector are shown in Table 4. All three subsectors showed over-the-year job growth: oil & gas extraction (83, or 3.7%), mining, except oil & gas (240, or 3.2%), and support activities for mining (290, or 4.3%).
The possibility of mining for rare earth minerals in Wyoming has been a topic of conversation in recent years. Employment in this industry is somewhat small: in 2023Q3, employment in metal ore mining (which includes rare earth minerals) was 114, up by 13 jobs (12.5%) over the year.
Mining has historically contributed more wages to the statewide total than any other industry. However, total wages in mining have decreased substantially along with the number of jobs since the 2015-2016 economic downturn. Total wages in mining peaked at $637.4 million in 2014Q4, or 18.0% of the state's total wages; this amounts to essentially $1 of every $5 of total payroll. In contrast, mining had $432.3 million in total wages in 2023Q3, or 10.5% of the state's total wages and roughly $1 of every $10 of total payroll.
High wages in mining have remained consistent over the last decade. As previously mentioned, mining had the highest average weekly wage of all industries in 2023Q3 ($1,936 compared to $1,111 across all industries).
Construction (NAICS 23)
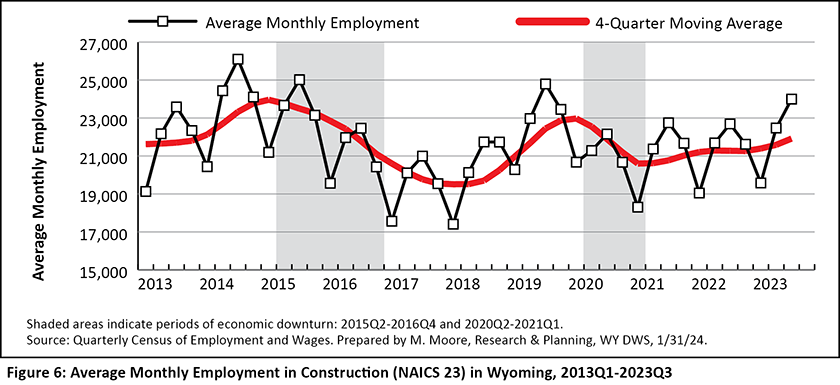
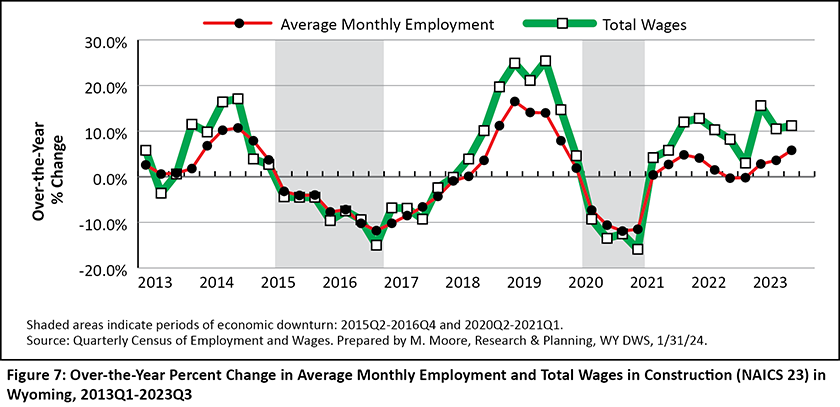
Average monthly employment in Wyoming's construction sector has risen and fallen multiple times over the last decade. Employment typically peaks during the third quarter of each year in the warm summer months (see Figure 6). The construction sector often adds jobs when there are large-scale projects (such as pipelines or wind farms) and loses jobs once those projects are complete. Through 2023Q3, average monthly employment and total wages in Wyoming's construction sector increased for 10 consecutive quarters (see Figure 7). In 2019Q3, the average monthly employment in construction was 24,790, or 3.2% (795 jobs) higher than in 2023Q3.
Average monthly employment in construction increased from 22,688 in 2022Q3 to 23,995 in 2023Q3 (1,307 jobs, or 5.8%; see Table 5). Noticeable growth was seen in the heavy & civil engineering construction subsector, which added 1,045 jobs (19.3%). As mentioned by Bullard (2024), this subsector contains power & communication system construction, including the construction of wind farms. The specialty trade contractors subsector added 137 jobs (1.1%), while construction of buildings added 124 (2.7%).
Total wages in construction increased from $363.1 million in 2022Q3 to $403.9 million in 2023Q3 ($40.8 million, or 11.2%). More than half of the increase in total wages ($24.8 million) was in heavy & civil engineering construction.
Construction accounted for 9.8% of Wyoming's total wages in 2023Q3, second only to mining. Since 2001, construction has made up between 9% and 10% of the state's total wages during the third quarter of each year.
Average weekly wages in construction tend to be higher than the state's overall average, but not as high as wages in mining. As previously mentioned, the average weekly wage in construction was $1,295, compared to the statewide average of $1,111.
Professional & Business Services (NAICS 54-56)
Professional & business services is a supersector consisting of three sectors: professional & technical services (NAICS 54), management of companies & enterprises (NAICS 55), and administrative & waste services (NAICS 56).
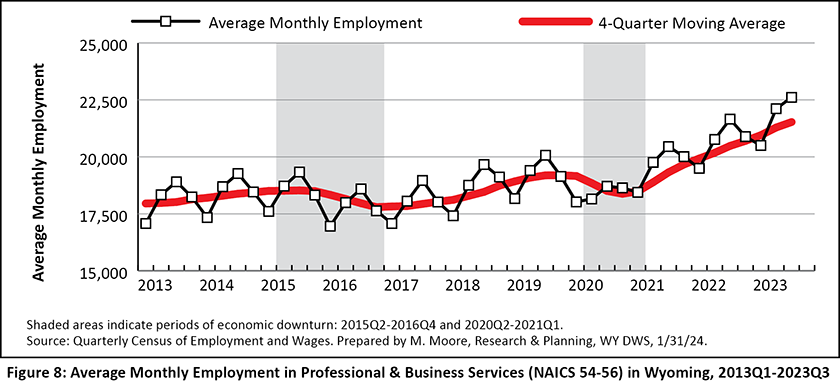
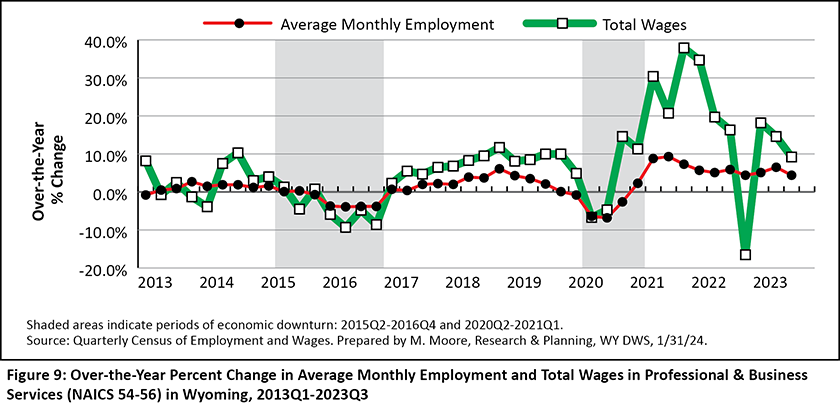
As illustrated in Figure 8 and Figure 9, employment and wages in professional & business services expanded substantially over the last two years. Similar to industries like construction and leisure & hospitality, professional & business services also has a seasonal component to its employment, peaking in third quarter.
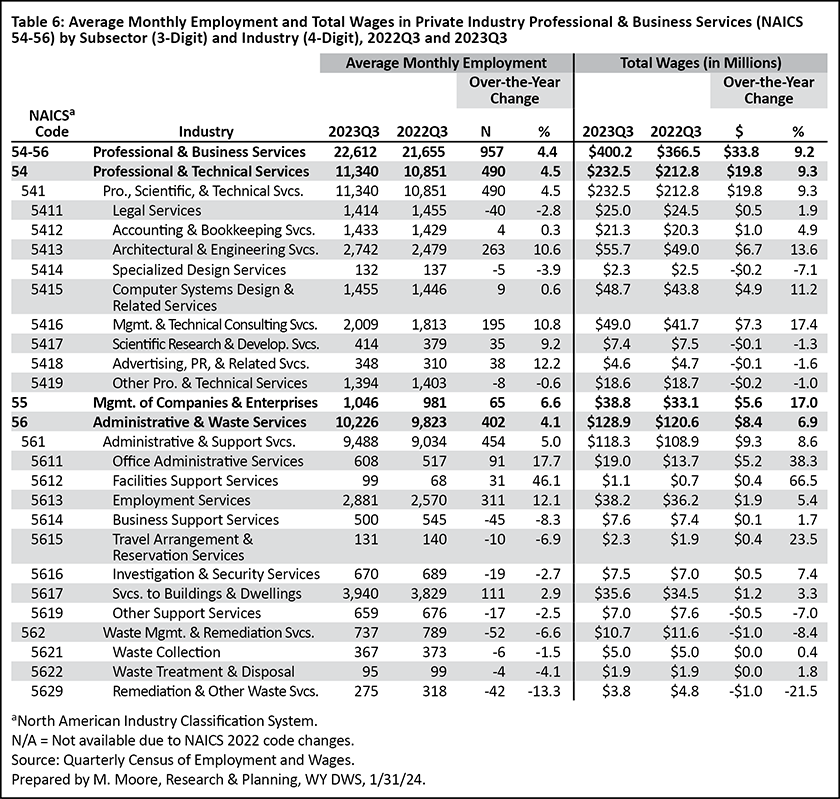
Average monthly employment increased from 21,655 in 2022Q3 to 22,612 in 2023Q3 (957 jobs, or 4.4%; see Table 6). Within the professional & technical services sector, architectural & engineering services (263 jobs, or 10.6%) and management and technical consulting services (195, or 10.8%) showed the greatest growth. In the administrative & waste services sector, noticeable growth was seen in employment services (311, or 12.1%) and services to buildings & dwellings (111, or 2.9%).
Total wages in professional & business services increased from $366.5 million to $400.2 million ($33.8 million, or 9.2%).
Professional & business services contributed an increasing number of jobs and total wages to the statewide total over the last decade. In 2013Q3, this industry accounted for 6.6% of all jobs in Wyoming and 6.9% of total wages. In 2023Q3, professional & business services made up 7.9% of all jobs and 9.7% of total wages.
Average weekly wages in professional & business services tend to be higher compared to the statewide average. In 2023Q3, the average weekly wage for professional & business services was $1,362, compared to the overall average of $1,111.
Leisure & Hospitality (NAICS 71-72)
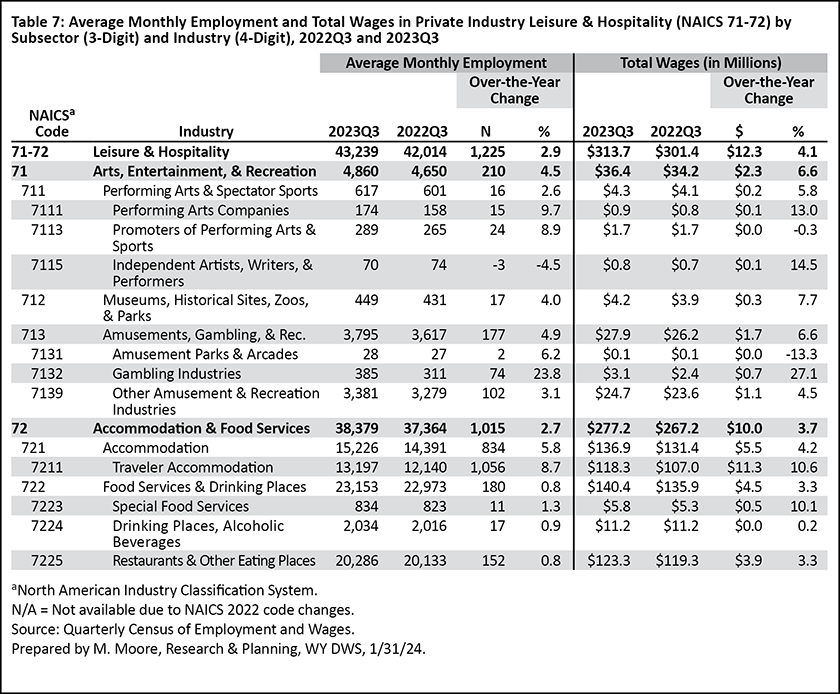
The leisure & hospitality supersector consists of two sectors: arts, entertainment, & recreation (NAICS 71) and accommodation & food services (NAICS 72; see Table 7).
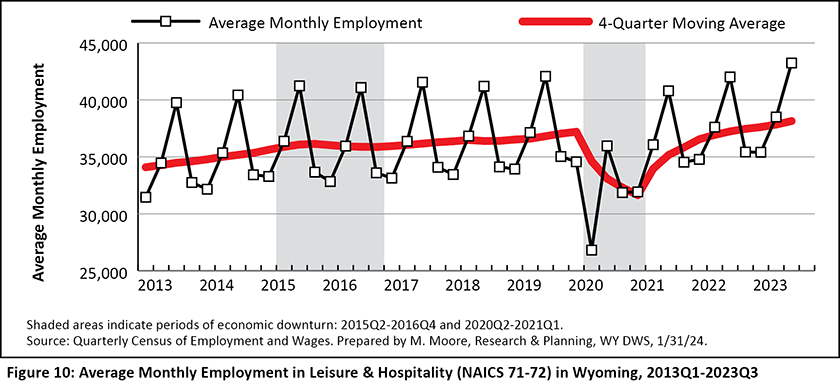
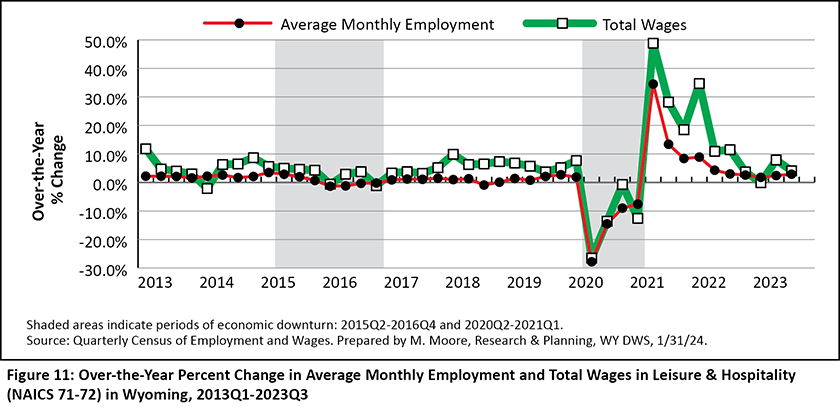
Figure 10 and Figure 11 illustrate the job losses in leisure & hospitality during the pandemic. Since then, however, leisure & hospitality has seen substantial employment and wage growth; most notably, leisure & hospitality reached an all-time high in employment of 43,239 in 2023Q3. From 2020Q3 during the pandemic to 2023Q3, leisure & hospitality added nearly 7,300 jobs, a 20.2% increase.
Over the year, employment in leisure & hospitality increased by 1,225 jobs, or 2.9% (see Table 7). Within the accommodation & food services sector, traveler accommodations added 1,056 jobs, an increase of 8.7%.
Total wages in leisure & hospitality increased from $301.4 million in 2022Q3 to $313.7 million in 2023Q3 ($12.3 million, or 4.1%).
Leisure & hospitality accounted for a greater proportion of jobs (15.1%) than any other industry in the state. However, leisure & hospitality only accounted for 7.6% of the state's total wages. This indicates a large number of lower-paying jobs in this industry compared to others. In 2023Q3, leisure & hospitality had the lowest average weekly wage ($558) of any industry in Wyoming.
County
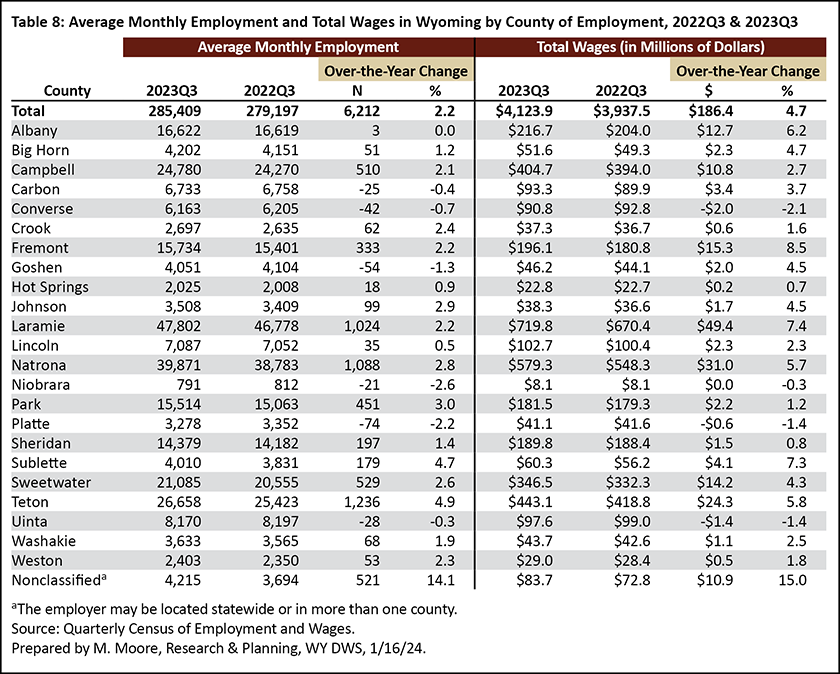
Over-the-year job growth occurred in 17 of Wyoming's 23 counties (see Table 8). Teton County added the greatest number of jobs (1,236, or 4.9% growth), followed by Natrona (1,088, or 2.8%), Laramie (1,024, or 2.2%), and Sweetwater (529, or 2.6%) counties. The six counties with over-the-year job losses were Platte (-74, or -2.2%), Goshen (-54, or -1.3%), Converse (-42, or -0.7%), Uinta (-28, or -0.3%), Carbon (-25, or -0.4%), and Niobrara (-21, or -2.6%).
The counties that saw the greatest over-the-year increase in total wages were Laramie ($49.4 million, or 7.4%), Natrona ($31.0 million, or 5.7%), Teton ($24.3 million, or 5.8%), and Sweetwater ($14.2 million, or 4.3%).
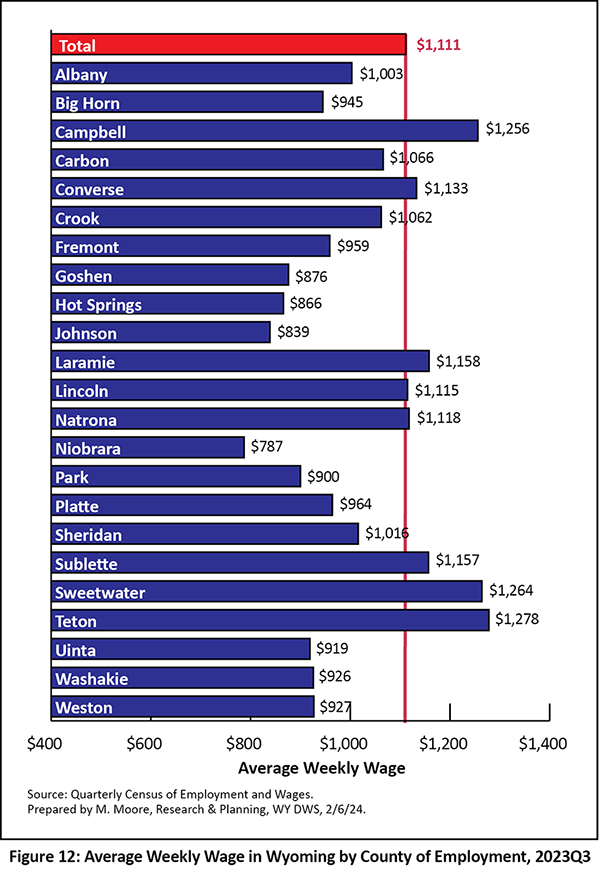
The counties with the highest average weekly wages (see Figure 12) were generally those with greater concentrations of high-paying mining jobs, such as Sweetwater ($1,264), Campbell ($1,256), and Sublette ($1,157). Teton County had the highest weekly wage of $1,278; this is due in large part to high wages in industries such as management of companies & enterprises ($8,115) and finance & insurance ($3,778).
Conclusion
Third quarter 2023 marked the 10th consecutive quarter of over-the-year job growth for Wyoming, as the state added more than 6,200 jobs and $186.4 million in total wages. Construction showed particularly strong job growth, adding more than 1,300 jobs and $40.8 million in total wages. In addition, Wyoming's average monthly employment of 285,409 surpassed pre-pandemic levels from 2019Q3 by 1,349 jobs (0.5%)
Quarterly employment and wage data for Wyoming from the QCEW are available online at https://doe.state.wy.us/LMI/toc_202.htm. Data for 2023Q4 will be released on May 3, 2024, with a feature article planned for the July 2024 issue of Wyoming Labor Force Trends.
References
Bullard, D. (2024, February 2). Wyoming employment and payroll: Construction sector leads job growth in third quarter 2023. Research & Planning, WY DWS. Retrieved February 6, 2024, from https://doe.state.wy.us/lmi/QCEW/23Q3.pdf
Moore, M. (2019, May). Chapter 1: Introduction — Driven by demographics and downturns: Wyoming’s 2018 labor market at a glance. 2019 Wyoming Workforce Annual Report. Research & Planning, WY DWS. Retrieved September 6, 2023, from https://doe.state.wy.us/LMI/annual-report/2019/2019_Annual_Report.pdf
 Hire Wyo
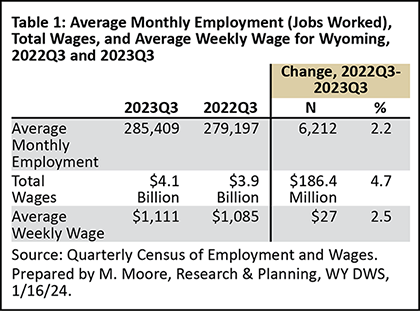