Wyoming Labor Force Trends
February 2024 | Volume 61, No. 2
Click Here for PDF
Return to Table of Contents
Twenty Years of Job Growth and Decline in Wyoming Counties
by: David Bullard, Senior Economist
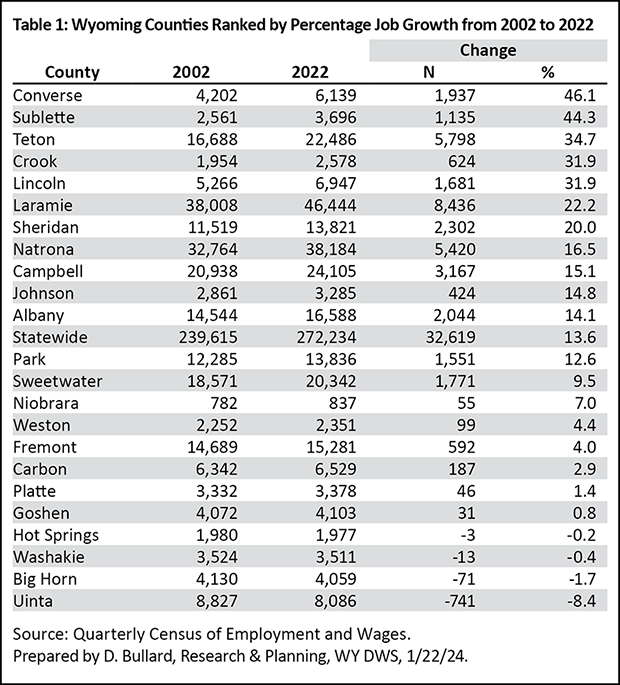
From 2002 to 2022, Wyoming added 32,619 jobs, an increase of 13.6%. This article profiles the five fastest growing counties and the three counties with the largest job losses. The data presented in this article are from the Quarterly Census of Employment and Wages (QCEW), developed through a cooperative program between the Research & Planning (R&P) section of the Wyoming Department of Workforce Services and the U.S. Bureau of Labor Statistics. The figures discussed can be found by clicking on the Tables and Figures tab.
The map in Figure 1 shows the percentage job growth for each of Wyoming’s 23 counties. The fastest growth occurred in Converse (46.1%), Sublette (44.3%), Teton (34.7%), Crook (31.9%), and Lincoln (31.9%) counties. On the other hand, net job losses were seen in Uinta (-8.4%), Big Horn (-1.7%), Washakie (-0.4%), and Hot Springs (-0.2%) counties. Table 1 provides a ranking of the counties by percentage job growth. Each county has a different story and most counties saw various ups and downs over the decades.
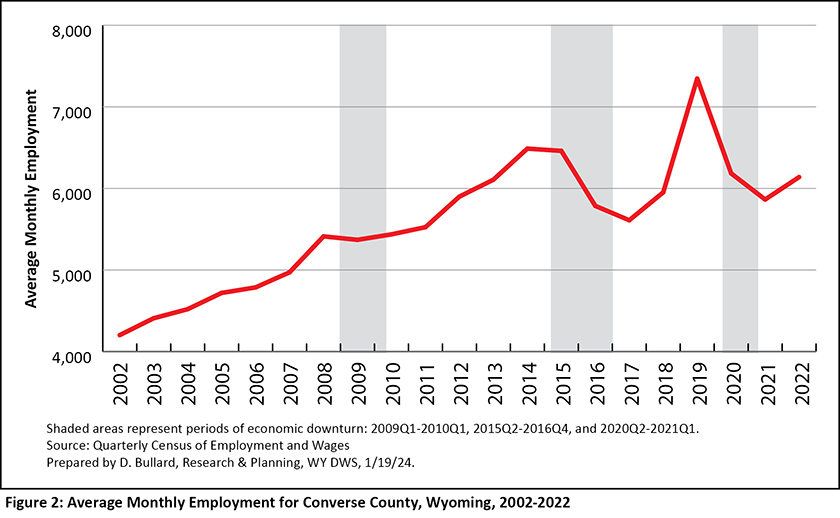
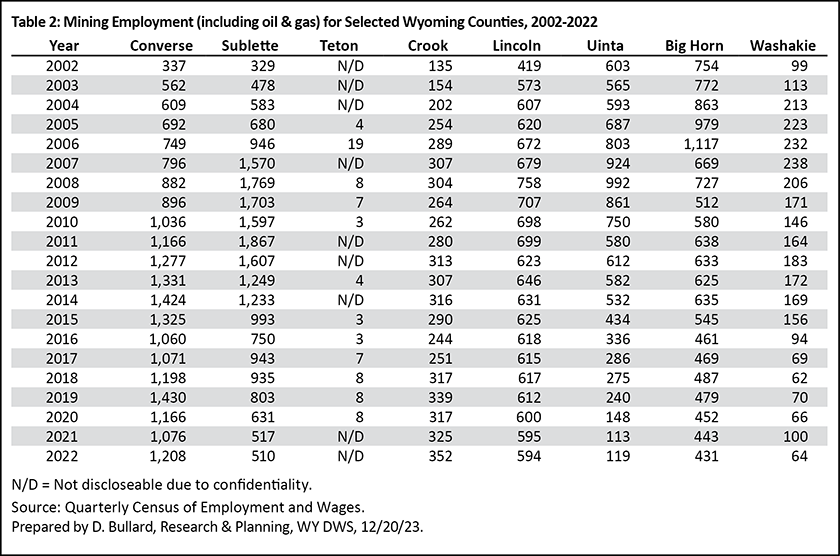
From 2002 to 2022, Converse County added 1,937 jobs (46.1%; see Figure 2). Total employment grew steadily from 2002 to 2014. As shown in Table 2, the mining sector (including oil & gas) added more than 1,087 jobs from 2002 to 2014 as oil & gas drilling activity expanded in the county. Then, from 2014 to 2017, Converse County's total employment fell by nearly 900 jobs. Energy prices peaked in the summer of 2014 and then fell sharply in late 2014 and early 2015. Wyoming’s statewide rig count decreased from 61 in October 2014 to single digits in the spring and summer of 2016.
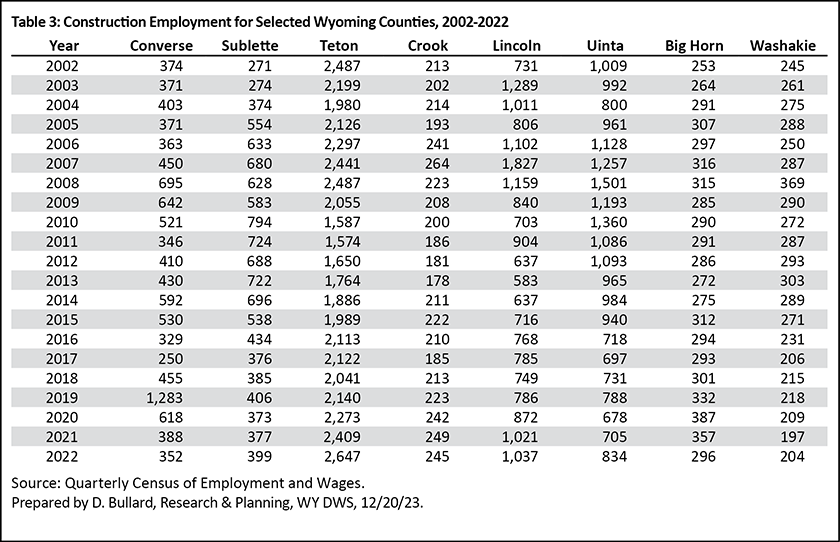
Converse County’s 2019 peak in employment was largely associated with oil & gas pipeline and related structures construction. Table 3 shows that from 2017 to 2019, the construction sector added 1,033 jobs, and then from 2019 to 2021, construction employment fell by 895 jobs as projects were completed.
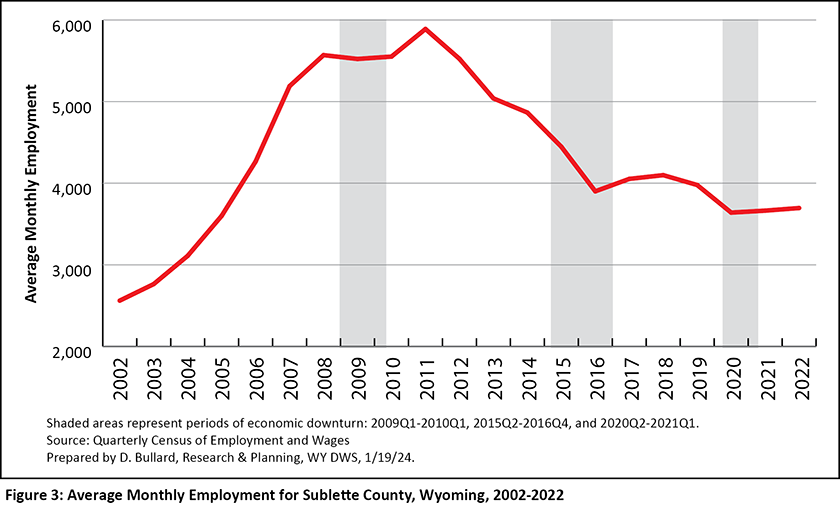
Figure 3 shows employment in Sublette County. The number of jobs expanded rapidly from 2002 to 2008 with employment in the mining sector (including oil & gas), rising from 329 to 1,769 (see Table 2), an increase of 437.7%. Total employment peaked in 2011 and generally declined after that.
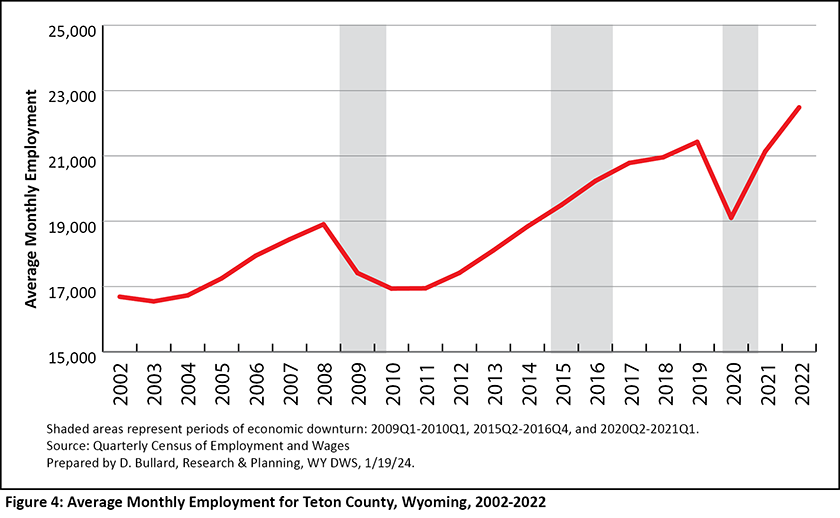
In contrast to Converse County and Sublette County, job growth and decline in Teton County was not related to the energy sector. Teton County’s employment peaked in 2008 and then again in 2019 (see Figure 4). The national Great Recession began in December 2007 (NBER, 2023) and probably affected Teton County more than most other places in Wyoming. Between 2008 and 2011, construction employment fell by 913 jobs (see Table 3). Leisure & hospitality employment also decreased during the Great Recession, falling by more than 500 jobs from 2008 to 2009.
Later, from 2019 to 2020, Teton County’s employment fell by approximately 2,300 jobs as the Covid-19 pandemic caused severe job losses in the leisure & hospitality sector. Total employment rebounded quickly in 2021 and 2022, rising by more than 3,300 jobs. The construction sector also expanded, adding 606 jobs from 2018 to 2022.
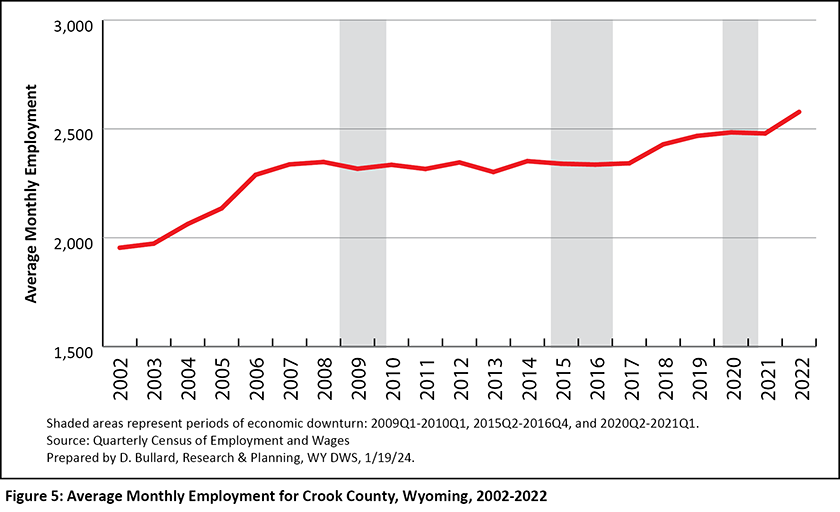
Crook County (see Figure 5) added 624 jobs (31.9%) from 2002 to 2022. More than one-third of the total job growth was accounted for by the mining sector (including oil & gas), which added 217 jobs. Substantial job gains were also seen in professional & business services (109 jobs).
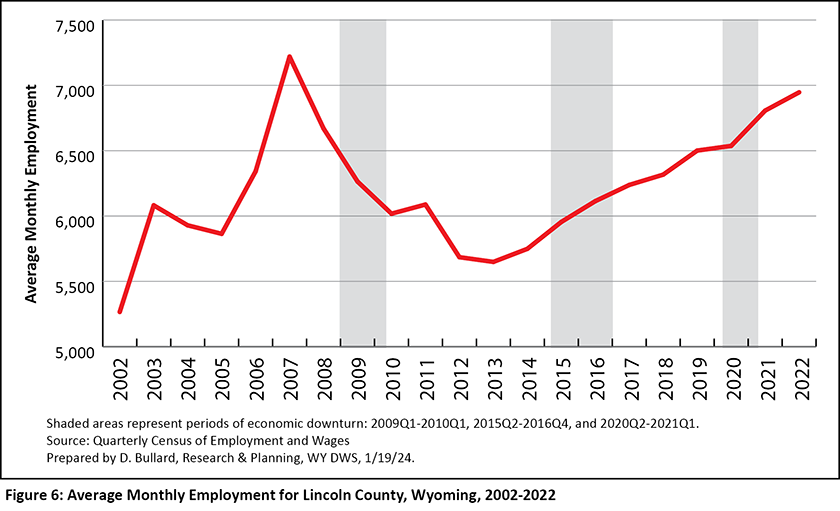
Lincoln County’s employment peaked at 7,220 jobs in 2007 and has not returned to that level (see Figure 6). It appears that the construction sector was largely responsible for the 2007 spike in employment. From 2005 to 2007, construction employment rose by 1,021 jobs, and then, from 2007 to 2009, it fell by nearly 987 jobs (see Table 3). The net gain in total employment from 2002 to 2022 was the result of job gains in many sectors, including local government (417 jobs), construction (306 jobs), professional & business services (179 jobs), and leisure & hospitality (105 jobs).
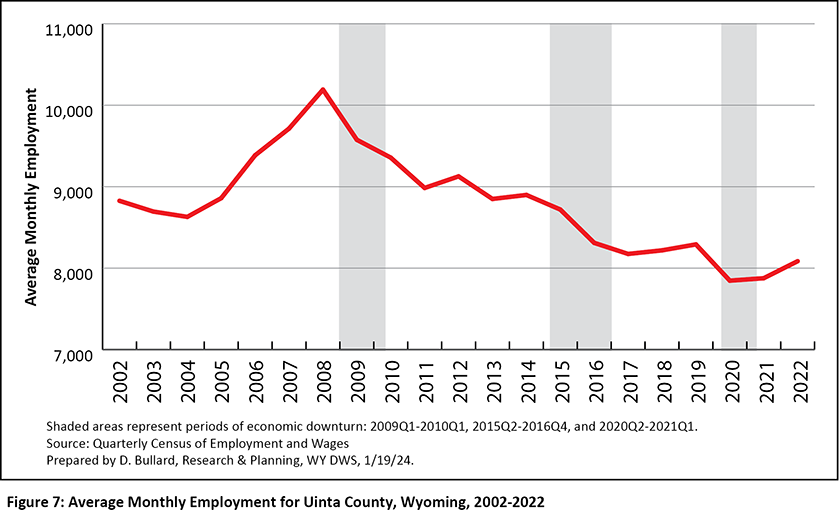
Figure 7 shows that Uinta County’s employment peaked in 2008 and generally trended down since then. Mining employment hit a high point of 992 jobs in 2008 and then decreased to 119 jobs in 2022 (see Table 2). From 2002 to 2022, employment declined in several sectors, including mining (down 484 jobs), construction (down 175 jobs), state government (down 151 jobs), and professional & business services (down 112 jobs).
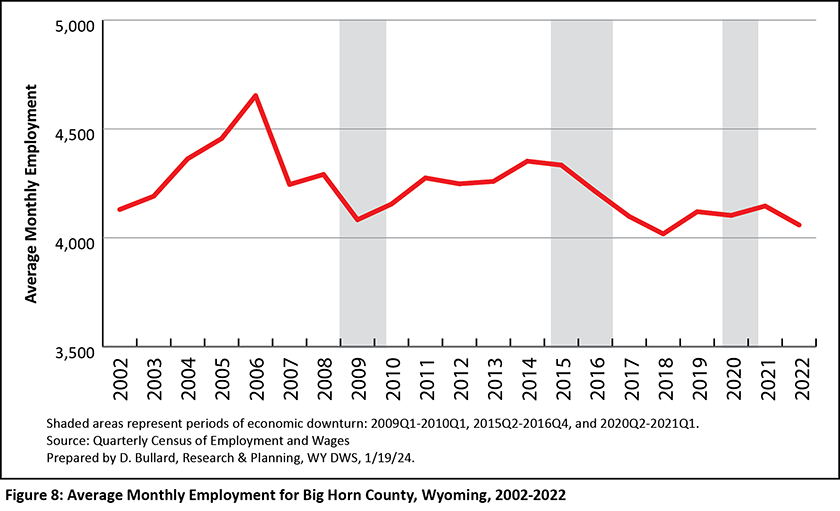
Big Horn County’s employment fell by 71 jobs (-1.7%) from 2002 to 2022 (see Figure 8). The mining sector (including oil & gas) lost 323 jobs from 2002 to 2022. However, those job losses were partially offset by job gains in professional & business services (210 jobs) and manufacturing (149 jobs).
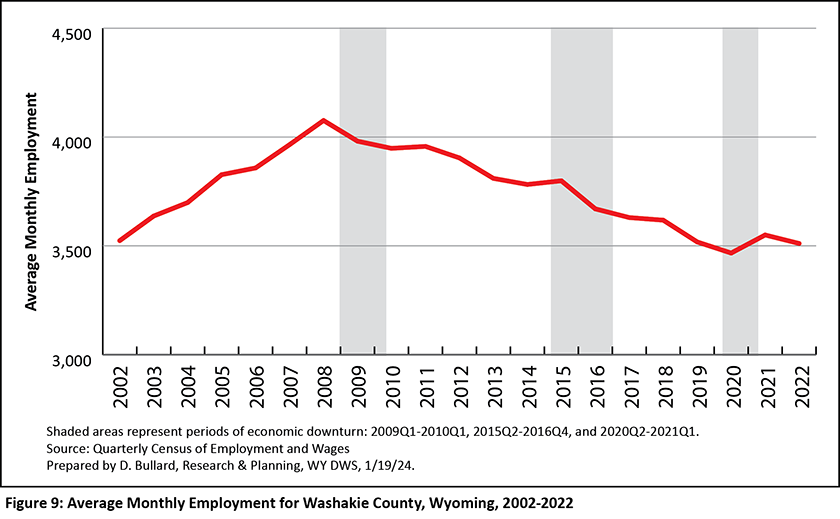
Figure 9 shows that Washakie County’s employment peaked in 2008. From 2002 to 2022, employment declined modestly in many sectors, including leisure & hospitality (-47 jobs), federal government (-42 jobs), construction (-41 jobs), mining (including oil & gas; -35 jobs), state government (-35 jobs), professional & business services (-31 jobs), and retail trade (-25 jobs). Over the same time period, manufacturing employment grew by 71 jobs.
Conclusion
Looking back over the past two decades, Wyoming’s two fastest growing counties, Converse and Sublette, benefitted from increased oil & gas activity and related construction projects. On the other end of the spectrum, Uinta and Big Horn counties saw net job losses that were mostly related to falling employment in the energy sector. Of the five growing counties profiled in the article, two saw peak employment levels in 2022 (Teton and Crook counties), while employment peaked in earlier years in the other three. Converse County and Lincoln County saw spikes in employment related to large construction projects in 2019 and 2007, respectively. Sublette County’s employment peaked in 2011 and generally declined after that. At the county level, much of the ups and downs in total employment is related to growth and decline in mining employment (including oil & gas) and large construction projects.
References
National Bureau of Economic Research. (2023). U.S. business cycle expansions and contractions. Retrieved November 28, 2023, from https://www.nber.org/research/data/us-business-cycle-expansions-and-contractions
 Hire Wyo
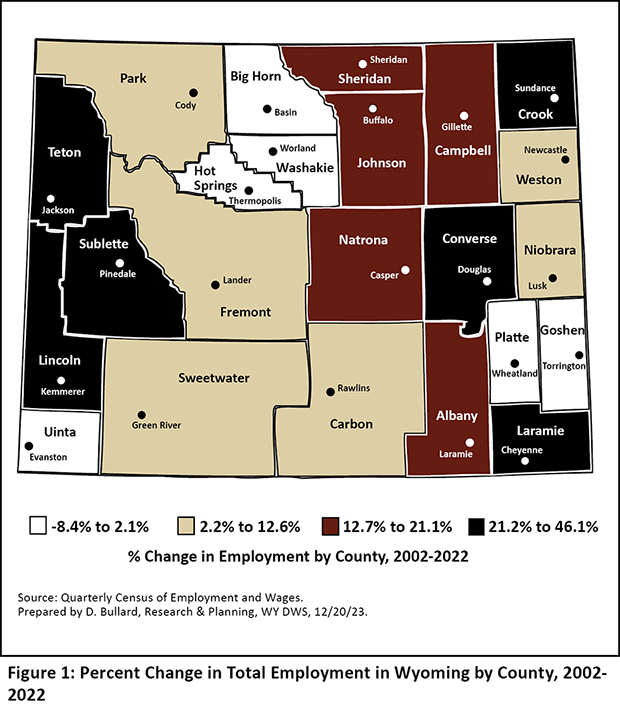