
Short-Term Projections:
Mining Leads Projected Job Growth for 2018-2020
by: Patrick Manning, Principal Economist
Wyoming is projected to add more than 5,000 jobs from 2018 to 2020, according to the most recent short-term projections from the Research & Planning (R&P) section of the Wyoming Department of Workforce Services. Research & Planning develops short-term employment projections by industry and occupation.
Industry Projections
Industries are classified according to the North American Industry Classification System (NAICS). The industry projections are developed at the three-digit NAICS subsector level and then summed to the two-digit major industries shown in the table.
The short-term industry projections indicate that Wyoming’s employment is expected to grow by 5,461 jobs (2.0%) from second quarter 2018 (2018Q2) to second quarter 2020 (2020Q2). At the two-digit level, job growth is forecast for all sectors, with the exception of construction (NAICS 23), retail trade (NAICS 44-45), information (NAICS 51), and government.
The largest job growth is projected in mining (NAICS 21; 1,608 jobs, or 7.9%), followed by accommodation & food services (NAICS 72; 830, or 2.5%), transportation & warehousing (NAICS 48-49; 556, or 4.3%), and wholesale trade (NAICS 42; 544, or 6.7%).
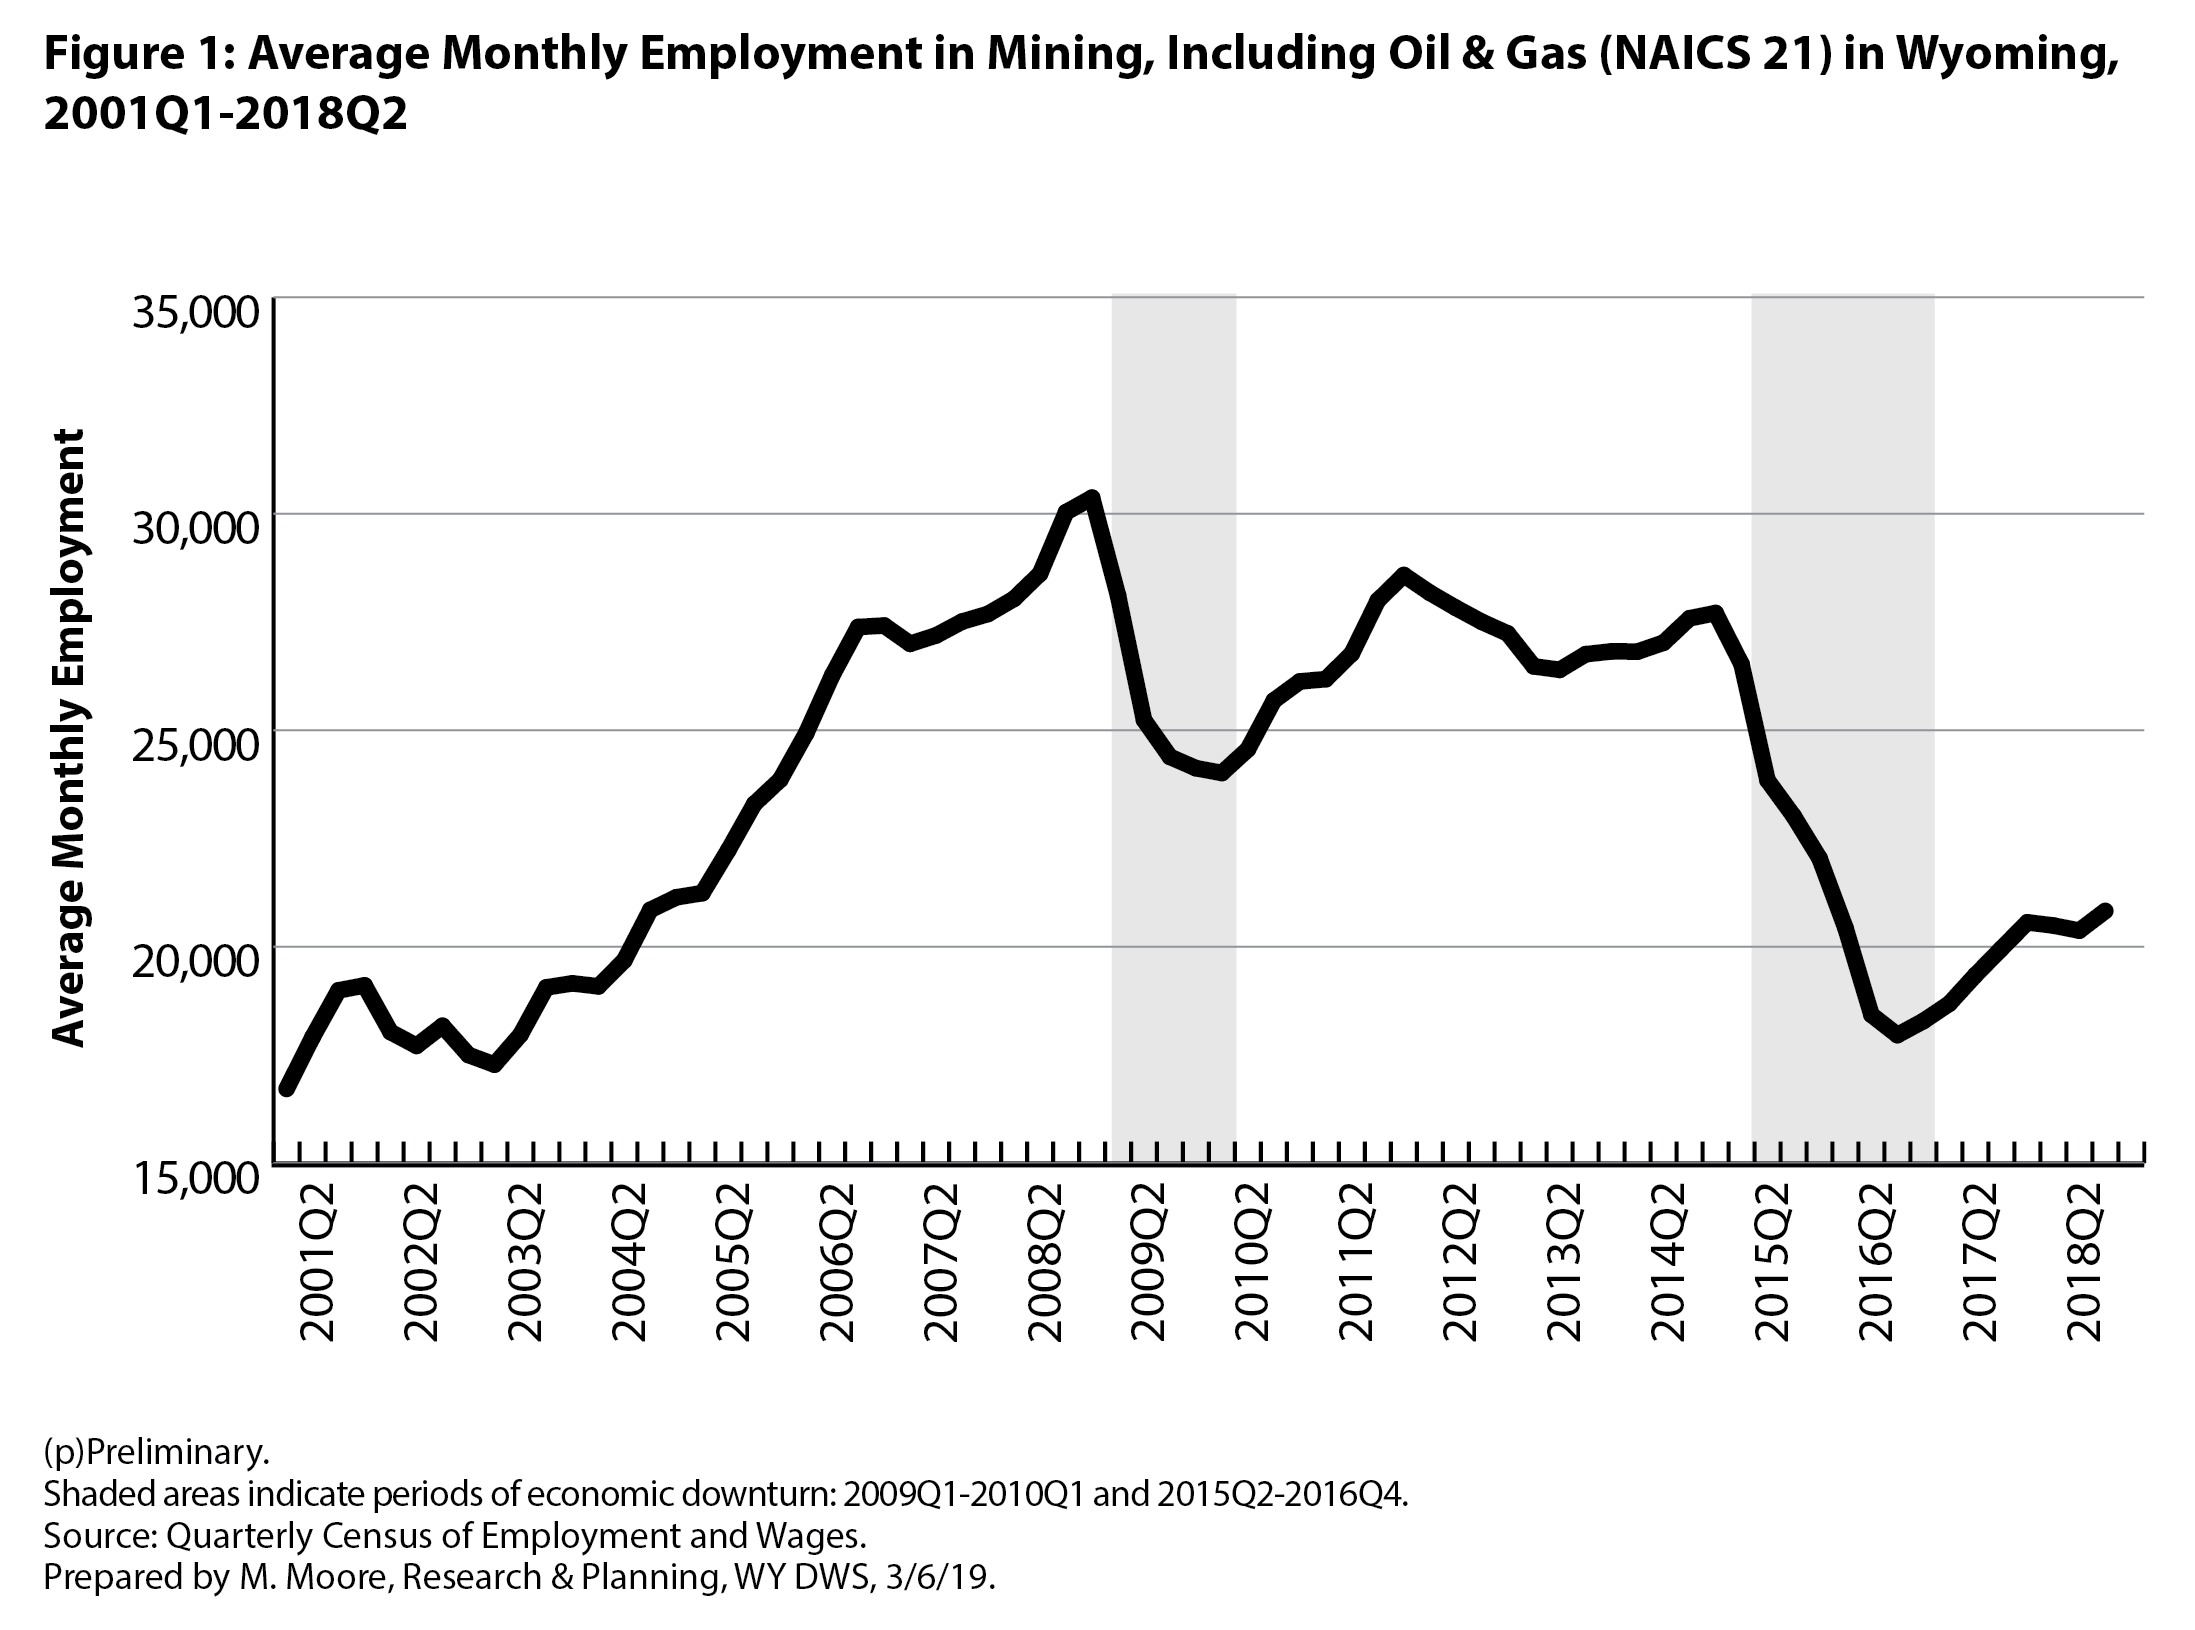
Over the last decade, Wyoming has experienced two periods of economic downturn, defined as “at least two consecutive quarters of over-the-year decrease in average monthly employment and total wages” based on data from the Quarterly Census of Employment and Wages (QCEW; Moore, 2018). The changes in average monthly employment in mining from 2001Q1 to 2018Q2 are illustrated in Figure 1. During both economic downturns (2009Q1-2010Q1 and 2015Q2-2016Q4), mining experienced substantial job losses, and employment in mining bottomed out in 2016Q3 with slightly less than 18,000 jobs, the fewest mining jobs in Wyoming since 2003Q1. Since then, however, mining has seen increases in employment through the time of the base period used in these projections (2018Q2).
Projections are based on historic trends of how employment levels respond to market conditions. Oil prices were relatively favorable for Wyoming suppliers at the time of these projections, and therefore employment levels were expected to continue increasing. While the oil production conditions are currently advantageous for Wyoming, the global energy supply/demand situation could change abruptly.
To put the 2020Q2 projected employment of 21,919 in mining into perspective, the most recent peak employment levels in the mining sector were approximately 28,000 in 2011Q4 and 2012Q1 when West Texas Intermediate crude oil prices hovered around $100 per barrel (EIA, 2018). The 2016Q3 lows in employment were preceded by crude oil prices as low as $30 per barrel. At the time these projections were produced, crude oil hovered around $50 per barrel.
Health care & social assistance (NAICS 62) is projected to grow slightly by 339 jobs (1.0%). Growth in this sector has been tempered somewhat due to a decrease in Wyoming’s population each year from 2015 to 2018 (Liu, 2018). This is also a reason that employment in educational services (NAICS 61) is expected to only grow modestly by 490 jobs (1.7%).
At the three-digit subsector level, many of the projected increases and decreases are greater than at the two-digit sector level. For example, Wyoming’s manufacturing sector (NAICS 31-33), is expected to add 251 jobs overall (2.6%), but some subsectors are expected to decrease or maintain a constant level of employment, while others are expected to grow faster than average. For example, food manufacturing (NAICS 311) is expected to decrease by 21.5% while fabricated metal product manufacturing machinery manufacturing (NAICS 332) is projected to grow by 15.8%.
Occupational Projections
Occupations are classified using the Standard Occupational Classification (SOC) system. Short-term occupational projections show anticipated job growth and openings due to workers exiting the workforce or changing occupations through 2020Q2. Total openings are calculated by projected growth or decline (numeric change) in the number of jobs in a given occupation, plus the number of workers leaving the workforce (exits), plus the number of workers changing occupations (transfers). In almost all occupations, the total number of job openings is largely dictated by the number of workers leaving the workforce and the number of workers changing occupations. The projected growth or decline is generally a small component of total openings.
For example, the occupational projections table shows that the number of waiters & waitresses (SOC 35-3031) in Wyoming is projected to grow from 5,571 in 2018Q2 to 5,711 in 2020Q2, a growth of 140, or 2.5%. However, an additional 835 openings are projected due to individuals exiting the occupation, and an additional 1,279 openings are projected due to transfers. The total number of openings – growth plus exits plus transfers – is projected to be 2,254.
Forthcoming research from R&P will discuss occupational projections by typical educational requirement. That article will be published in Wyoming Labor Force Trends and in the 2019 Wyoming Workforce Annual Report.
References
Liu., W. (2018, December). Wyoming population declined slightly. Economic Analysis Division, Wyoming Administration & Information. Retrieved March 6, 2018, from http://eadiv.state.wy.us/pop/ST-18EST.pdf
Moore, M. (2018, October). 2018Q2 quarterly update: Mining, manufacturing lead job growth in Wyoming. Wyoming Labor Force Trends, 55(10). Research & Planning, Wyoming DWS. Retrieved March 6, 2019, from http://doe.state.wy.us/LMI/trends/1018/1018.pdf
U.S. Energy Information Administration. (2018). Spot prices for crude oil and petroleum products. Retrieved March 6, 2019, from https://www.eia.gov/
