Economic Indicators
    by: Margaret Hiatt,   Administrative/Survey Support Specialist
    The number of building permits issued for single-family homes decreased by 31.6% from August 2009 to August 2010.


         | 
         | 
         | 
         | 
        Aug | 
        July | 
        Aug | 
        Percent    Change | 
      
      
         | 
         | 
         | 
         | 
        2010 | 
        2010 | 
        2009 | 
         Month | 
         Year | 
      
      
         | 
         | 
         | 
         | 
        ______(p)_ | 
        ______(r)_ | 
        _____(b)_ | 
        _____ | 
        _____ | 
      
      
        | Wyoming    Total Civilian Labor Force(1) | 
         | 
        294,996 | 
        295,786 | 
        297,848 | 
        -0.3 | 
        -1.0 | 
      
      
         | 
         | 
        Unemployed | 
         | 
        18,948 | 
        18,494 | 
        19,438 | 
        2.5 | 
        -2.5 | 
      
      
         | 
         | 
        Employed | 
         | 
        276,048 | 
        277,292 | 
        278,410 | 
        -0.4 | 
        -0.8 | 
      
      
        | Wyoming    Unemployment Rate/Seas. Adj. | 
         | 
        6.4%/6.8% | 
        6.3%/6.7% | 
        6.5%/7.1% | 
        N/A | 
        N/A | 
      
      
        | U.S.    Unemployment Rate/Seas. Adj. | 
         | 
        9.5%/9.6% | 
        9.7%/9.5% | 
        9.6%/9.7% | 
        N/A | 
        N/A | 
      
      
        | U.S.    Multiple Jobholders | 
         | 
        6,515,000 | 
        6,579,000 | 
        6,772,000 | 
        -1.0 | 
        -3.8 | 
      
      
         | 
        As a percent of all    workers | 
         | 
        4.7% | 
        4.7% | 
        4.8% | 
        N/A | 
        N/A | 
      
      
        | U.S.    Discouraged Workers | 
         | 
        1,110,000 | 
        1,185,000 | 
        758,000 | 
        -6.3 | 
        46.4 | 
      
      
        | U.S.    Part Time for Economic Reasons | 
         | 
        8,628,000 | 
        8,737,000 | 
        8,835,000 | 
        -1.2 | 
        -2.3 | 
      
      
         | 
         | 
         | 
         | 
         | 
         | 
         | 
         | 
         | 
      
      
        | Hours    & Earnings for Production Workers | 
         | 
         | 
         | 
         | 
         | 
         | 
      
      
        | Wyoming    Manufacturing Hours & Earnings | 
         | 
         | 
         | 
         | 
         | 
         | 
      
      
         | 
        Average Weekly Earnings | 
          | 
        $832.64 | 
        $814.64 | 
        $838.80 | 
        2.2 | 
        -0.7 | 
      
      
         | 
        Average Weekly Hours | 
         | 
        40.4 | 
        39.7 | 
        40.0 | 
        1.8 | 
        1.0 | 
      
      
        | U.S.    Manufacturing Hours & Earnings | 
         | 
         | 
         | 
         | 
         | 
         | 
      
      
         | 
        Average Weekly Earnings | 
         | 
        $765.08 | 
        $762.82 | 
        $732.40 | 
        0.3 | 
        4.5 | 
      
      
         | 
        Average Weekly Hours | 
         | 
        41.2 | 
        41.1 | 
        40.0 | 
        0.2 | 
        3.0 | 
      
      
         | 
         | 
         | 
         | 
         | 
         | 
         | 
         | 
         | 
      
      
        | Wyoming    Unemployment Insurance | 
         | 
         | 
         | 
         | 
         | 
         | 
      
      
         | 
        Weeks Compensated (2) | 
         | 
        24,040 | 
        23,321 | 
        34,666 | 
        3.1 | 
        -30.7 | 
      
      
         | 
        Benefits Paid | 
         | 
        $7,921,332 | 
        $7,705,320 | 
        $12,242,073 | 
        2.8 | 
        -35.3 | 
      
      
         | 
        Average Weekly Benefit    Payment | 
         | 
        $329.51 | 
        $330.40 | 
        $353.14 | 
        -0.3 | 
        -6.7 | 
      
      
         | 
        State Insured Covered    Jobs (1) | 
         | 
        268,875 | 
        268,079 | 
        266,705 | 
        0.3 | 
        0.8 | 
      
      
         | 
        Insured Unemployment Rate  | 
         | 
        2.3% | 
        2.5% | 
        2.8% | 
        N/A | 
        N/A | 
      
      
         | 
         | 
         | 
         | 
         | 
         | 
         | 
         | 
         | 
      
      
        | Consumer Price    Index (U) for All U.S. Urban Consumers  | 
         | 
         | 
         | 
         | 
         | 
         | 
      
      
        | (1982    to 1984 = 100) | 
         | 
         | 
         | 
         | 
         | 
         | 
      
      
         | 
        All Items | 
         | 
        218.3 | 
        218.0 | 
        215.8 | 
        0.1 | 
        1.1 | 
      
      
         | 
         | 
        Food & Beverages | 
         | 
        219.9 | 
        219.5 | 
        217.7 | 
        0.2 | 
        1.0 | 
      
      
         | 
         | 
        Housing | 
         | 
        217.0 | 
        217.1 | 
        217.8 | 
        0.0 | 
        -0.4 | 
      
      
         | 
         | 
        Apparel | 
         | 
        116.7 | 
        115.2 | 
        117.1 | 
        1.2 | 
        -0.4 | 
      
      
         | 
         | 
        Transportation | 
         | 
        193.5 | 
        193.0 | 
        184.4 | 
        0.2 | 
        4.9 | 
      
      
         | 
         | 
        Medical Care | 
         | 
        388.5 | 
        387.9 | 
        376.5 | 
        0.1 | 
        3.2 | 
      
      
         | 
         | 
        Recreation (Dec. 1997=100) | 
         | 
        113.5 | 
        113.7 | 
        114.8 | 
        -0.1 | 
        -1.1 | 
      
      
         | 
         | 
        Education & Communication (Dec. 1997=100) | 
         | 
        130.6 | 
        129.6 | 
        128.1 | 
        0.8 | 
        1.9 | 
      
      
         | 
         | 
        Other Goods & Services | 
         | 
        383.7 | 
        383.2 | 
        372.7 | 
        0.1 | 
        2.9 | 
      
      
         | 
         | 
         | 
         | 
         | 
         | 
         | 
         | 
         | 
      
      
        | Producer    Prices (1982 to 1984 = 100) | 
         | 
         | 
         | 
         | 
         | 
         | 
      
      
         | 
        All Commodities | 
         | 
        184.5 | 
        184.2 | 
        175.0 | 
        0.2 | 
        5.4 | 
      
      
         | 
         | 
         | 
         | 
         | 
         | 
         | 
         | 
         | 
      
      
        | Wyoming    Building Permits (New Privately Owned Housing Units Authorized) | 
         | 
         | 
         | 
         | 
      
      
         | 
        Total Units | 
         | 
        108 | 
        200 | 
        324 | 
        -46.0 | 
        -66.7 | 
      
      
         | 
         | 
        Valuation | 
         | 
        $29,760,000 | 
        $39,858,000 | 
        $45,967,000 | 
        -25.3 | 
        -35.3 | 
      
      
         | 
        Single Family Homes | 
         | 
        91 | 
        151 | 
        133 | 
        -39.7 | 
        -31.6 | 
      
      
         | 
         | 
        Valuation | 
         | 
        $28,686,000 | 
        $36,389,000 | 
        $32,353,000 | 
        -21.2 | 
        -11.3 | 
      
      
         | 
        Casper MSA2 Building Permits | 
         | 
        27 | 
        19 | 
        29 | 
        42.1 | 
        -6.9 | 
      
      
         | 
         | 
        Valuation | 
         | 
        $3,237,000 | 
        $4,367,000 | 
        $3,613,000 | 
        -25.9 | 
        -10.4 | 
      
      
         | 
        Cheyenne MSA Building    Permits | 
         | 
        13 | 
        38 | 
        11 | 
        -65.8 | 
        18.2 | 
      
      
         | 
         | 
        Valuation | 
         | 
        $2,095,000 | 
        $4,331,000 | 
        $1,909,000 | 
        -51.6 | 
        9.7 | 
      
      
         | 
         | 
         | 
         | 
         | 
         | 
         | 
         | 
         | 
      
      
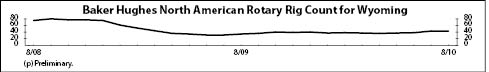
        | Baker    Hughes North American Rotary Rig Count for Wyoming | 
         | 
        43 | 
        43 | 
        34 | 
        0.0 | 
        26.5 | 
      
      
         | 
         | 
         | 
         | 
         | 
         | 
         | 
         | 
         | 
      
      
         | 
         | 
         | 
         | 
         | 
         | 
         | 
         | 
         | 
      
      
        | (p)    Preliminary (r) Revised (1) Local Area Unemployment Statistics Program    estimates | 
      
      
        | 2    Metropolitan Statistical Area | 
      
    
    