Economic Indicators
Regular Unemployment Insurance benefits paid in Wyoming fell by 31.3% from April 2010 to April 2011.
| Apr | Mar | Apr | Percent Change | |||||
| 2011 | 2011 | 2010 | Month | Year | ||||
| ______(p)_ | ______(r)_ | _____(b)_ | _____ | _____ | ||||
| Wyoming Total Nonfarm Employment | 279,500 | 277,700 | 276,900 | 0.6 | 0.9 | |||
| Wyoming State Government | 17,400 | 17,200 | 16,900 | 1.2 | 3.0 | |||
| Laramie County Nonfarm Employment | 43,700 | 43,200 | 43,000 | 1.2 | 1.6 | |||
| Natrona County Nonfarm Employment | 38,300 | 38,200 | 38,400 | 0.3 | -0.3 | |||
| Selected U.S. Employment Data | ||||||||
| U.S. Multiple Jobholders | 6,887,000 | 6,809,000 | 7,105,000 | 1.1 | -3.1 | |||
| As a percent of all workers | 4.9% | 4.9% | 5.1% | N/A | N/A | |||
| U.S. Discouraged Workers | 989,000 | 921,000 | 1,197,000 | 7.4 | -17.4 | |||
| U.S. Part Time for Economic Reasons | 8,425,000 | 8,737,000 | 8,921,000 | -3.6 | -5.6 | |||
| Wyoming Unemployment Insurance | ||||||||
| Weeks Compensated | 27,339 | 37,443 | 38,237 | -27.0 | -28.5 | |||
| Benefits Paid | $8,781,163 | $12,063,896 | $12,783,320 | -27.2 | -31.3 | |||
| Average Weekly Benefit Payment | $321.20 | $322.19 | $334.32 | -0.3 | -3.9 | |||
| State Insured Covered Jobs1 | 254,075 | 253,578 | 253,024 | 0.2 | 0.4 | |||
| Insured Unemployment Rate | 2.9% | 3.2% | 4.0% | N/A | N/A | |||
| Consumer Price Index (U) for All U.S. Urban Consumers | ||||||||
| (1982 to 1984 = 100) | ||||||||
| All Items | 224.9 | 223.5 | 218.0 | 0.6 | 3.2 | |||
| Food & Beverages | 226.2 | 225.5 | 219.5 | 0.3 | 3.1 | |||
| Housing | 217.9 | 217.7 | 215.8 | 0.1 | 1.0 | |||
| Apparel | 122.2 | 121.3 | 122.1 | 0.7 | 0.1 | |||
| Transportation | 216.9 | 211.0 | 194.0 | 2.8 | 11.8 | |||
| Medical Care | 398.8 | 397.7 | 387.7 | 0.3 | 2.9 | |||
| Recreation (Dec. 1997=100) | 113.4 | 113.3 | 113.8 | 0.1 | -0.4 | |||
| Education & Communication (Dec. 1997=100) | 130.6 | 130.7 | 129.3 | -0.1 | 1.0 | |||
| Other Goods & Services | 386.2 | 385.6 | 378.9 | 0.2 | 1.9 | |||
| Producer Prices (1982 to 1984 = 100) | ||||||||
| All Commodities | 202.8 | 199.1 | 184.4 | 1.9 | 10.0 | |||
| Wyoming Building Permits (New Privately Owned Housing Units Authorized) | ||||||||
| Total Units | 152 | 153 | 142 | -0.7 | 7.0 | |||
| Valuation | $38,594,000 | $29,105,000 | $30,710,000 | 32.6 | 25.7 | |||
| Single Family Homes | 142 | 99 | 137 | 43.4 | 3.6 | |||
| Valuation | $37,616,000 | $24,965,000 | $30,395,000 | 50.7 | 23.8 | |||
| Casper MSA2 Building Permits | 17 | 27 | 19 | -37.0 | -10.5 | |||
| Valuation | $2,605,000 | $3,237,000 | $3,306,000 | -19.5 | -21.2 | |||
| Cheyenne MSA2 Building Permits | 16 | 51 | 32 | -68.6 | -50.0 | |||
| Valuation | $2,876,000 | $5,434,000 | $4,525,000 | -47.1 | -36.4 | |||
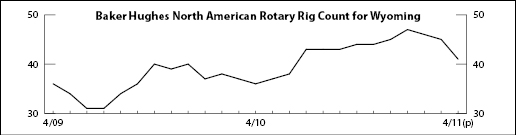
| Baker Hughes North American Rotary Rig Count for Wyoming | 41 | 45 | 36 | -8.9 | 13.9 | |||
| (p) Preliminary. (r) Revised. (b) Benchmarked. 1 Local Area Unemployment Statistics Program estimates. |
||||||||
| 2 Metropolitan Statistical Area. | ||||||||
| Note: Production worker hours and earnings data have been dropped from the Economic Indicators page because of problems with accuracy due to a small sample size and high item nonresponse. The Bureau of Labor Statistics will continue to publish these data online at http://www.bls.gov/eag/eag.wy.htm | ||||||||