Economic Indicators
    by: Margaret Hiatt, Administrative/Survey Support Specialist
    Wyoming’s seasonally adjusted unemployment rate fell from 7.4% in October to 7.2% in November. 


         | 
         | 
         | 
         | 
        Nov | 
        Oct | 
        Nov | 
        Percent Change | 
      
      
         | 
         | 
         | 
         | 
        2009 | 
        2009 | 
        2008 | 
         Month | 
         Year | 
      
      
         | 
         | 
         | 
         | 
        ______(p)_ | 
        ______(r)_ | 
        _____(b)_ | 
        _____ | 
        _____ | 
      
      
        | Wyoming Total Civilian Labor Force1 | 
         | 
        291,234 | 
        291,923 | 
        292,956 | 
        -0.2 | 
        -0.6 | 
      
      
         | 
         | 
        Unemployed | 
         | 
        20,475 | 
        19,992 | 
        9,199 | 
        2.4 | 
        122.6 | 
      
      
         | 
         | 
        Employed | 
         | 
        270,759 | 
        271,931 | 
        283,757 | 
        -0.4 | 
        -4.6 | 
      
      
        | Wyoming Unemployment Rate/Seas. Adj. | 
         | 
        7.0%/7.2% | 
        6.8%/7.4% | 
        3.1%/3.1% | 
        N/A | 
        N/A | 
      
      
        | U.S. Unemployment Rate/Seas. Adj. | 
         | 
        9.4%/10.0% | 
        9.5%/10.2% | 
        6.5%/6.8% | 
        N/A | 
        N/A | 
      
      
        | U.S. Multiple Jobholders | 
         | 
        7,222,000 | 
        7,224,000 | 
        7,539,000 | 
        0.0 | 
        -4.2 | 
      
      
         | 
        As a percent of all workers | 
         | 
        5.2% | 
        5.2% | 
        5.2% | 
        N/A | 
        N/A | 
      
      
        | U.S. Discouraged Workers | 
         | 
        861,000 | 
        808,000 | 
        608,000 | 
        6.6 | 
        41.6 | 
      
      
        | U.S. Part Time for Economic Reasons | 
         | 
        8,894,000 | 
        8,474,000 | 
        7,135,000 | 
        5.0 | 
        24.7 | 
      
      
         | 
         | 
         | 
         | 
         | 
         | 
         | 
         | 
         | 
      
      
        | Hours    & Earnings for Production Workers | 
      
      
        | Wyoming Manufacturing Hours & Earnings | 
         | 
         | 
         | 
         | 
         | 
         | 
      
      
         | 
        Average Weekly Earnings | 
          | 
        $804.40 | 
        $829.78 | 
        $919.09 | 
        -3.1 | 
        -12.5 | 
      
      
         | 
        Average Weekly Hours | 
         | 
        40.2 | 
        40.3 | 
        43.6 | 
        -0.2 | 
        -7.8 | 
      
      
        | U.S. Manufacturing Hours & Earnings | 
         | 
         | 
         | 
         | 
         | 
         | 
      
      
         | 
        Average Weekly Earnings | 
         | 
        $750.31 | 
        $739.72 | 
        $726.57 | 
        1.4 | 
        3.3 | 
      
      
         | 
        Average Weekly Hours | 
         | 
        40.8 | 
        40.4 | 
        40.5 | 
        1.0 | 
        0.7 | 
      
      
         | 
         | 
         | 
         | 
         | 
         | 
         | 
         | 
         | 
      
      
        | Wyoming
          Unemployment Insurance | 
      
      
         | 
        Weeks Compensated 2 | 
         | 
        34,971 | 
        32,019 | 
        12,555 | 
        9.2 | 
        178.5 | 
      
      
         | 
        Benefits Paid | 
         | 
        $11,749,825 | 
        $11,097,512 | 
        $3,833,824 | 
        5.9 | 
        206.5 | 
      
      
         | 
        Average Weekly Benefit Payment | 
         | 
        $335.99 | 
        $346.59 | 
        $305.36 | 
        -3.1 | 
        10.0 | 
      
      
         | 
        State Insured Covered Jobs (1) | 
         | 
        278,524 | 
        281,871 | 
        272,580 | 
        -1.2 | 
        2.2 | 
      
      
         | 
        Insured Unemployment Rate  | 
         | 
        2.8% | 
        2.6% | 
        1.1% | 
        N/A | 
        N/A | 
      
      
         | 
         | 
         | 
         | 
         | 
         | 
         | 
         | 
         | 
      
      
        | Consumer Price Index (U) for All U.S. Urban
          Consumers  | 
      
      
        | (1982 to 1984 = 100) | 
         | 
         | 
         | 
         | 
         | 
         | 
      
      
         | 
        All Items | 
         | 
        216.3 | 
        216.2 | 
        212.4 | 
        0.1 | 
        1.8 | 
      
      
         | 
         | 
        Food & Beverages | 
         | 
        217.7 | 
        218.0 | 
        218.8 | 
        -0.1 | 
        -0.5 | 
      
      
         | 
         | 
        Housing | 
         | 
        215.8 | 
        216.6 | 
        216.5 | 
        -0.4 | 
        -0.3 | 
      
      
         | 
         | 
        Apparel | 
         | 
        122.5 | 
        124.0 | 
        121.3 | 
        -1.2 | 
        1.0 | 
      
      
         | 
         | 
        Transportation | 
         | 
        188.6 | 
        185.4 | 
        173.6 | 
        1.7 | 
        8.6 | 
      
      
         | 
         | 
        Medical Care | 
         | 
        379.6 | 
        378.6 | 
        366.6 | 
        0.3 | 
        3.5 | 
      
      
         | 
         | 
        Recreation (Dec. 1997=100) | 
         | 
        113.8 | 
        114.2 | 
        114.1 | 
        -0.3 | 
        -0.2 | 
      
      
         | 
         | 
        Education & Communication (Dec. 1997=100) | 
         | 
        128.8 | 
        129.1 | 
        125.8 | 
        -0.2 | 
        2.5 | 
      
      
         | 
         | 
        Other Goods & Services | 
         | 
        376.7 | 
        375.4 | 
        349.0 | 
        0.3 | 
        7.9 | 
      
      
         | 
         | 
         | 
         | 
         | 
         | 
         | 
         | 
         | 
      
      
        | Producer Prices (1982 to 1984 = 100) | 
      
      
         | 
        All Commodities | 
         | 
        177.7 | 
        175.3 | 
        176.8 | 
        1.4 | 
        0.5 | 
      
      
         | 
         | 
         | 
         | 
         | 
         | 
         | 
         | 
         | 
      
      
        | Wyoming Building Permits (New Privately Owned
          Housing Units Authorized) | 
      
      
         | 
        Total Units | 
         | 
        86 | 
        96 | 
        107 | 
        -10.4 | 
        -19.6 | 
      
      
         | 
         | 
        Valuation | 
         | 
        $22,811,000 | 
        $15,633,000 | 
        $18,652,000 | 
        45.9 | 
        22.3 | 
      
      
         | 
        Single Family Homes | 
         | 
        86 | 
        88 | 
        65 | 
        -2.3 | 
        32.3 | 
      
      
         | 
         | 
        Valuation | 
         | 
        $22,811,000 | 
        $15,373,000 | 
        $15,943,000 | 
        48.4 | 
        43.1 | 
      
      
         | 
        Casper MSA2 Building Permits | 
         | 
        11 | 
        12 | 
        8 | 
        -8.3 | 
        37.5 | 
      
      
         | 
         | 
        Valuation | 
         | 
        $3,702,000 | 
        $1,764,000 | 
        $1,153,000 | 
        109.9 | 
        221.1 | 
      
      
         | 
        Cheyenne MSA Building Permits | 
         | 
        8 | 
        14 | 
        7 | 
        -42.9 | 
        14.3 | 
      
      
         | 
         | 
        Valuation | 
         | 
        $2,527,000 | 
        $1,637,000 | 
        $1,184,000 | 
        54.4 | 
        113.4 | 
      
      
         | 
         | 
         | 
         | 
         | 
         | 
         | 
         | 
         | 
      
      
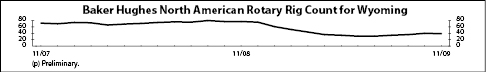
        | Baker Hughes North American Rotary Rig Count
          for Wyoming | 
         | 
        39 | 
        40 | 
        77 | 
        -2.5 | 
        -49.4 | 
      
      
         | 
         | 
         | 
         | 
         | 
         | 
         | 
         | 
         | 
      
      
         | 
         | 
         | 
         | 
         | 
         | 
         | 
         | 
         | 
      
      
        (p) Preliminary. (r) Revised.  
          1 Local Area
          Unemployment Statistics Program estimates. | 
         | 
         | 
         | 
      
      
        | 2 Metropolitan Statistical Area. | 
         | 
         | 
         | 
         | 
         | 
         | 
      
    
    