Local Jobs and Payroll in Wyoming: Mining Sector Contracts in Fourth Quarter 2012
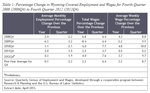 |
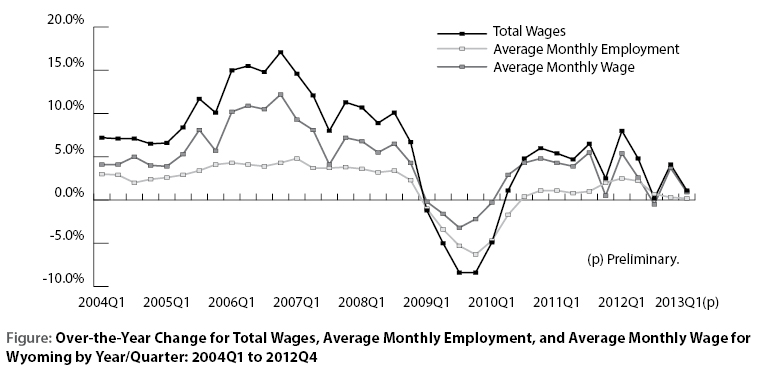
Total unemployment insurance (UI) covered payroll increased by $127.7 million (4.0%) in fourth quarter 2012. Employment rose by 866 jobs (0.3%) and average weekly wage increased by $32 (3.7%). In fourth quarter, total wages, employment, and average weekly wage grew slightly faster than their five year averages. However, large job losses in the mining sector (including oil & gas; -1,278 jobs, or -4.5%) caused overall job growth to slow to its lowest level in more than two years. Additionally, employment at temporary help agencies fell by nearly 400 jobs.
Continue Reading →
Also Inside:
Total Wages, Average Monthly Employment, and Average Monthly Wage Changes for Wyoming by Year/Quarter: 2004Q1 to 2013Q1
The Cornerstone: Building an American Public Policy for Educational Attainment and Success in the Labor Market
(This is an excerpt from The Cornerstone: Building an American Public Policy for Educational Attainment and Success in the Labor Market, available in its entirety here. It is part of a series of articles forthcoming in Wyoming Labor Force Trends on the intersection of higher education and education and workforce policy in the United States.)
Continue Reading →
 |
Where Did They Go?
2000 Cohort in 2010 Tracking the Exit of 18-Year-Olds Working in Wyoming in 2000 and Where They Were Working in 2010
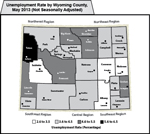
Wyoming Unemployment Rate Falls to 4.6% in May 2013
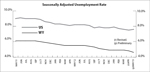 |
The Research & Planning section of the Wyoming Department of Workforce Services has reported that the state’s seasonally adjusted unemployment rate fell from 4.8% in April to 4.6% in May (not a statistically significant change). It remained significantly lower than the current U.S. unemployment rate of 7.6%. Seasonally adjusted employment of Wyoming residents increased slightly, rising by 983 individuals (0.3%) from April to May.
Continue Reading →
Contents

PDF Version
- Credits
- Local Jobs and Payroll in Wyoming: Mining Sector Contracts in Fourth Quarter 2012
- Total Wages, Average Monthly Employment, and Average Monthly Wage Changes for Wyoming by Year/Quarter: 2004Q1 to 2013Q1
- (Excerpt) The Cornerstone: Building an American Public Policy for Educational Attainment and Success in the Labor Market
- (Figure) Where Did They Go? 2000 Cohort in 2010 Tracking the Exit of 18-Year-Olds Working in Wyoming in 2000 and Where They Were Working in 2010
- Wyoming Unemployment Rate Falls to 4.6% in May 2013
- Current Employment Statistics (CES) Estimates and Research & Planning's Short-Term Projections, May 2013
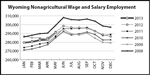
- Wyoming Nonagricultural Wage and Salary Employment
- Campbell County
- Sweetwater County
- Teton County
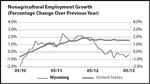
- Nonagricultural Employment Growth Graph
- Nonagricultural Wage and Salary Employment Graph
- Economic Indicators
- Wyoming Total Nonfarm Employment
- Selected U.S. Employment Data
- Multiple Jobholders
- Discouraged Workers
- Part-Time for Economic Reasons
- Consumer Price Index
- Wyoming Building Permits
- Baker Hughes Rig Count
- Wyoming County Unemployment Rates
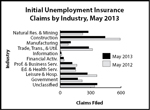
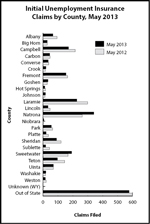
- Wyoming Normalized Unemployment Insurance Statistics: Initial Claims
- Statewide
- Laramie County
- Natrona County
- Statewide by Industry Graph
- Statewide by County Graph
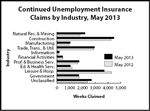
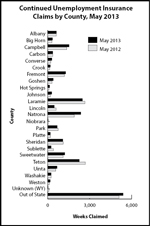
- Wyoming Normalized Unemployment Insurance Statistics: Continued Claims
- Statewide
- Laramie County
- Natrona County
- Statewide by Industry Graph
- Statewide by County Graph
- Map of Wyoming Regions, Counties, and County Seats with County Unemployment Rates