Economic Indicators 
 
    by: Margaret Hiatt, Administrative/Survey Support Specialist
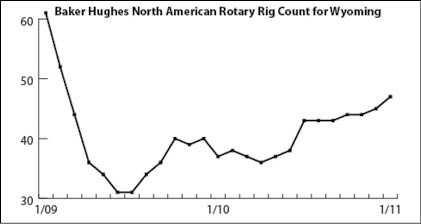
    The Baker Hughes rig count for Wyoming increased by 27.0% from January 2010 to January 2011. 


         | 
         | 
         | 
         | 
        Jan | 
        Dec | 
        Jan | 
        Percent Change | 
      
      
         | 
         | 
         | 
         | 
        2011 | 
        2010 | 
        2010 | 
         Month | 
         Year | 
      
      
         | 
         | 
         | 
         | 
        ______(p)_ | 
        ______(r)_ | 
        _____(b)_ | 
        _____ | 
        _____ | 
      
      
        | Wyoming Total Civilian Labor Force1 | 
         | 
        288,160 | 
        289,031 | 
        293,411 | 
        -0.3 | 
        -1.8 | 
      
      
         | 
         | 
        Unemployed | 
         | 
        21,247 | 
        18,429 | 
        25,630 | 
        15.3 | 
        -17.1 | 
      
      
         | 
         | 
        Employed | 
         | 
        266,913 | 
        270,602 | 
        267,781 | 
        -1.4 | 
        -0.3 | 
      
      
        | Wyoming Unemployment Rate/Seas. Adj. | 
         | 
        7.4%/6.3% | 
        6.4%/6.4% | 
        8.7%/7.6% | 
        N/A | 
        N/A | 
      
      
        | U.S. Unemployment Rate/Seas. Adj. | 
         | 
        9.8%/9.0% | 
        9.1%/9.4% | 
        10.6%/9.7% | 
        N/A | 
        N/A | 
      
      
        | U.S. Multiple Jobholders | 
         | 
        6,621,000 | 
        6,884,000 | 
        6,751,000 | 
        -3.8 | 
        -1.9 | 
      
      
         | 
        As a percent of all workers | 
         | 
        4.8% | 
        4.9% | 
        4.9% | 
        N/A | 
        N/A | 
      
      
        | U.S. Discouraged Workers | 
         | 
        993,000 | 
        1,318,000 | 
        1,065,000 | 
        -24.7 | 
        -6.8 | 
      
      
        | U.S. Part Time for Economic Reasons | 
         | 
        9,187,000 | 
        9,205,000 | 
        9,290,000 | 
        -0.2 | 
        -1.1 | 
      
      
         | 
         | 
         | 
         | 
         | 
         | 
         | 
         | 
         | 
      
      
        | Hours    & Earnings for Production Workers | 
      
      
        | Wyoming Manufacturing Hours & Earnings | 
         | 
         | 
         | 
         | 
         | 
         | 
      
      
         | 
        Average Weekly Earnings | 
          | 
        $842.74 | 
        $858.54 | 
        $837.43 | 
        -1.8 | 
        0.6 | 
      
      
         | 
        Average Weekly Hours | 
         | 
        40.4 | 
        41.0 | 
        40.3 | 
        -1.5 | 
        0.2 | 
      
      
        | U.S. Manufacturing Hours & Earnings | 
         | 
         | 
         | 
         | 
         | 
         | 
      
      
         | 
        Average Weekly Earnings | 
         | 
        $771.67 | 
        $788.35 | 
        $750.69 | 
        -2.1 | 
        2.8 | 
      
      
         | 
        Average Weekly Hours | 
         | 
        40.7 | 
        41.8 | 
        40.6 | 
        -2.6 | 
        0.2 | 
      
      
         | 
         | 
         | 
         | 
         | 
         | 
         | 
         | 
         | 
      
      
        | Wyoming
          Unemployment Insurance | 
      
      
         | 
        Weeks Compensated 2 | 
         | 
        32,494 | 
        30,800 | 
        45,103 | 
        5.5 | 
        -28.0 | 
      
      
         | 
        Benefits Paid | 
         | 
        $10,395,251 | 
        $9,618,508 | 
        $15,233,944 | 
        8.1 | 
        -31.8 | 
      
      
         | 
        Average Weekly Benefit Payment | 
         | 
        $319.91 | 
        $312.29 | 
        $337.76 | 
        2.4 | 
        -5.3 | 
      
      
         | 
        State Insured Covered Jobs (1) | 
         | 
        251,620 | 
        257,224 | 
        248,569 | 
        -2.2 | 
        1.2 | 
      
      
         | 
        Insured Unemployment Rate  |  
         | 
        3.4% | 
        2.5% | 
        4.7% | 
        N/A | 
        N/A | 
      
      
         | 
         | 
         | 
         | 
         | 
         | 
         | 
         | 
         | 
      
      
        | Consumer Price Index (U) for All U.S. Urban 
          Consumers  | 
      
      
        | (1982 to 1984 = 100) |  
         | 
         | 
         | 
         | 
         | 
         | 
      
      
         | 
        All Items | 
         | 
        220.2 | 
        219.2 | 
        216.7 | 
        0.5 | 
        1.6 | 
      
      
         | 
         | 
        Food & Beverages | 
         | 
        223.2 | 
        221.3 | 
        219.2 | 
        0.9 | 
        1.8 | 
      
      
         | 
         | 
        Housing | 
         | 
        216.7 | 
        216.1 | 
        215.9 | 
        0.3 | 
        0.4 | 
      
      
         | 
         | 
        Apparel | 
         | 
        116.7 | 
        118.1 | 
        116.7 | 
        -1.2 | 
        0.0 | 
      
      
         | 
         | 
        Transportation | 
         | 
        200.8 | 
        198.3 | 
        190.5 | 
        1.3 | 
        5.4 | 
      
      
         | 
         | 
        Medical Care | 
         | 
        393.9 | 
        391.9 | 
        382.7 | 
        0.5 | 
        2.9 | 
      
      
         | 
         | 
        Recreation (Dec. 1997=100) | 
         | 
        112.6 | 
        112.3 | 
        113.3 | 
        0.3 | 
        -0.6 | 
      
      
         | 
         | 
        Education & Communication (Dec. 1997=100) | 
         | 
        130.7 | 
        130.5 | 
        129.1 | 
        0.1 | 
        1.2 | 
      
      
         | 
         | 
        Other Goods & Services | 
         | 
        384.7 | 
        384.5 | 
        377.7 | 
        0.0 | 
        1.9 | 
      
      
         | 
         | 
         | 
         | 
         | 
         | 
         | 
         | 
         | 
      
      
        | Producer Prices (1982 to 1984 = 100) | 
      
      
         | 
        All Commodities | 
         | 
        192.2 | 
        189.9 | 
        181.9 | 
        1.2 | 
        5.7 | 
      
      
         | 
         | 
         | 
         | 
         | 
         | 
         | 
         | 
         | 
      
      
        | Wyoming Building Permits (New Privately Owned
          Housing Units Authorized) | 
      
      
         | 
        Total Units | 
         | 
        84 | 
        91 | 
        68 | 
        -7.7 | 
        23.5 | 
      
      
         | 
         | 
        Valuation | 
         | 
        $14,646,000 | 
        $17,586,000 | 
        $26,720,000 | 
        -16.7 | 
        -45.2 | 
      
      
         | 
        Single Family Homes | 
         | 
        64 | 
        74 | 
        68 | 
        -13.5 | 
        -5.9 | 
      
      
         | 
         | 
        Valuation | 
         | 
        $12,940,000 | 
        $16,107,000 | 
        $26,720,000 | 
        -19.7 | 
        -51.6 | 
      
      
         | 
        Casper MSA2 Building Permits | 
         | 
        9 | 
        17 | 
        2 | 
        -47.1 | 
        350.0 | 
      
      
         | 
         | 
        Valuation | 
         | 
        $1,349,000 | 
        $3,173,000 | 
        $188,000 | 
        -57.5 | 
        617.6 | 
      
      
         | 
        Cheyenne MSA Building Permits | 
         | 
        24 | 
        9 | 
        24 | 
        166.7 | 
        0.0 | 
      
      
         | 
         | 
        Valuation | 
         | 
        $2,938,000 | 
        $1,403,000 | 
        $4,111,000 | 
        109.4 | 
        -28.5 | 
      
      
         | 
         | 
         | 
         | 
         | 
         | 
         | 
         | 
         | 
      
      
        | Baker Hughes North American Rotary Rig Count
          for Wyoming | 
         | 
        47 | 
        45 | 
        37 | 
        4.4 | 
        27.0 | 
      
      
         | 
         | 
         | 
         | 
         | 
         | 
         | 
         | 
         | 
      
      
         | 
         | 
         | 
         | 
         | 
         | 
         | 
         | 
         | 
      
      
        (p) Preliminary. (r) Revised. (b) 
          Benchmarked.  
          1 Local Area 
          Unemployment Statistics Program estimates. |  
         | 
         | 
         | 
      
      
        | 2 Metropolitan Statistical Area. | 
         | 
         | 
         | 
         | 
         | 
         | 
      
    
    