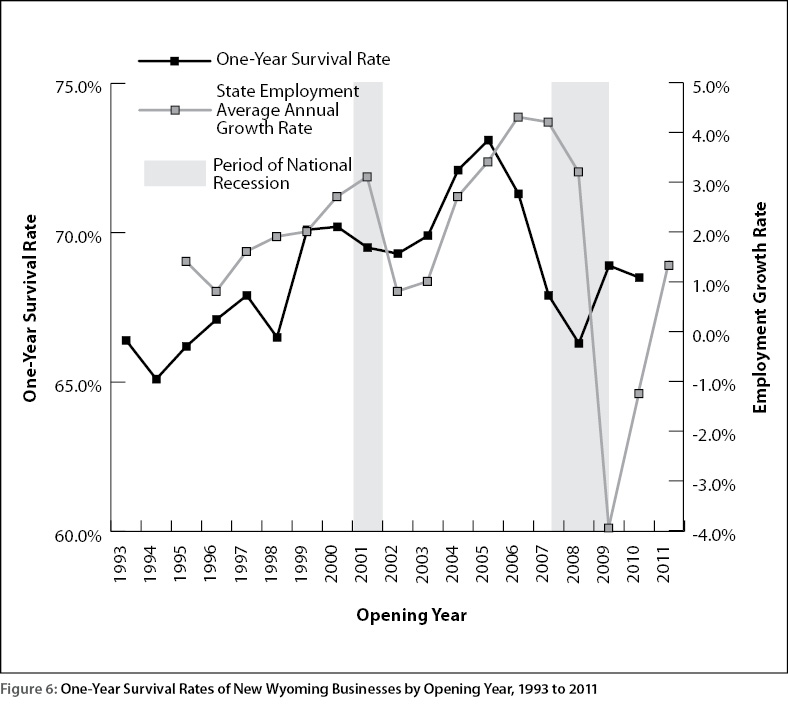
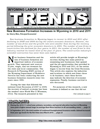
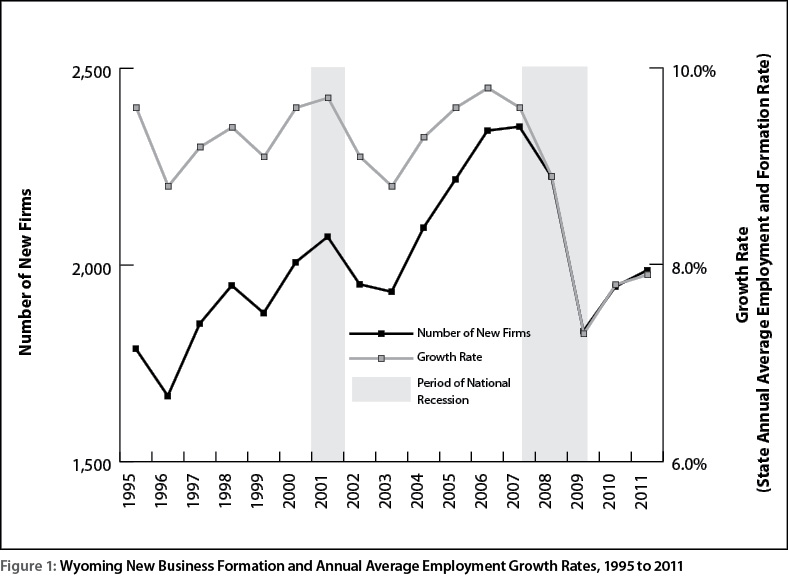
New Business Formation Increases in Wyoming
in 2010 and 2011 (Tables and Figures)
See Related Article
Tables 1, 2, 3, 4, 5, 6
Figures 1, 2, 3, 4, 5, 6
| Region and County | 2010 | 2011 | ||||||||||
|---|---|---|---|---|---|---|---|---|---|---|---|---|
| New Firms | Initial Jobs | Total Wages | New Firms | Initial Jobs | Total Wages | |||||||
| N | % | N | % | N | % | N | % | N | % | N | % | |
| Northwest | 285 | 14.7% | 873 | 11.2% | $15,553,010 | 9.1% | 258 | 13.0% | 809 | 11.6% | $14,460,432 | 10.2% |
| Big Horn | 28 | 1.4% | 75 | 1.0% | $1,087,524 | 0.6% | 22 | 1.1% | 74 | 1.1% | $1,405,526 | 1.0% |
| Fremont | 109 | 5.6% | 385 | 4.9% | $7,761,922 | 4.5% | 105 | 5.3% | 404 | 5.8% | $8,214,670 | 5.8% |
| Hot Springs | 15 | 0.8% | 39 | 0.5% | $309,266 | 0.2% | 16 | 0.8% | 51 | 0.7% | $534,196 | 0.4% |
| Park | 102 | 5.2% | 301 | 3.9% | $5,423,437 | 3.2% | 95 | 4.8% | 214 | 3.1% | $3,739,435 | 2.6% |
| Washakie | 31 | 1.6% | 73 | 0.9% | $970,861 | 0.6% | 20 | 1.0% | 66 | 0.9% | $566,605 | 0.4% |
| Northeast | 321 | 16.5% | 1,525 | 19.5% | $46,220,847 | 27.1% | 304 | 15.3% | 997 | 14.3% | $23,734,290 | 16.8% |
| Campbell | 152 | 7.8% | 885 | 11.3% | $37,313,986 | 21.9% | 123 | 6.2% | 596 | 8.5% | $16,271,352 | 11.5% |
| Crook | 14 | 0.7% | 37 | 0.5% | $605,501 | 0.4% | 22 | 1.1% | 46 | 0.7% | $732,232 | 0.5% |
| Johnson | 31 | 1.6% | 103 | 1.3% | $1,123,440 | 0.7% | 40 | 2.0% | 80 | 1.1% | $1,120,807 | 0.8% |
| Sheridan | 107 | 5.5% | 451 | 5.8% | $6,637,668 | 3.9% | 111 | 5.6% | 264 | 3.8% | $5,344,153 | 3.8% |
| Weston | 17 | 0.9% | 49 | 0.6% | $540,252 | 0.3% | 8 | 0.4% | 11 | 0.2% | $265,746 | 0.2% |
| Southwest | 495 | 25.4% | 1,788 | 22.9% | $36,763,916 | 21.5% | 511 | 25.7% | 1,636 | 23.4% | $34,315,892 | 24.3% |
| Lincoln | 64 | 3.3% | 190 | 2.4% | $3,176,579 | 1.9% | 80 | 4.0% | 225 | 3.2% | $3,000,258 | 2.1% |
| Sublette | 49 | 2.5% | 208 | 2.7% | $2,962,779 | 1.7% | 51 | 2.6% | 193 | 2.8% | $3,788,857 | 2.7% |
| Sweetwater | 121 | 6.2% | 574 | 7.4% | $10,483,518 | 6.1% | 129 | 6.5% | 421 | 6.0% | $7,971,725 | 5.6% |
| Teton | 206 | 10.6% | 562 | 7.2% | $16,765,722 | 9.8% | 184 | 9.3% | 447 | 6.4% | $14,221,050 | 10.1% |
| Uinta | 55 | 2.8% | 254 | 3.3% | $3,375,318 | 2.0% | 67 | 3.4% | 350 | 5.0% | $5,334,002 | 3.8% |
| Southeast | 468 | 24.1% | 1,690 | 21.7% | $35,090,523 | 20.6% | 476 | 24.0% | 1,388 | 19.9% | $24,860,381 | 17.6% |
| Albany | 68 | 3.5% | 391 | 5.0% | $3,594,306 | 2.1% | 87 | 4.4% | 259 | 3.7% | $4,028,050 | 2.8% |
| Goshen | 32 | 1.6% | 85 | 1.1% | $1,002,600 | 0.6% | 38 | 1.9% | 162 | 2.3% | $1,938,842 | 1.4% |
| Laramie | 328 | 16.9% | 1,114 | 14.3% | $29,364,128 | 17.2% | 314 | 15.8% | 886 | 12.7% | $18,003,491 | 12.7% |
| Niobrara | 6 | 0.3% | 11 | 0.1% | $221,721 | 0.1% | 14 | 0.7% | 33 | 0.5% | $342,621 | 0.2% |
| Platte | 34 | 1.7% | 89 | 1.1% | $907,768 | 0.5% | 23 | 1.2% | 48 | 0.7% | $547,377 | 0.4% |
| Central | 302 | 15.5% | 1,408 | 18.0% | $27,159,094 | 15.9% | 345 | 17.4% | 1,562 | 22.3% | $32,046,559 | 22.7% |
| Carbon | 54 | 2.8% | 430 | 5.5% | $7,223,016 | 4.2% | 39 | 2.0% | 148 | 2.1% | $2,609,843 | 1.8% |
| Converse | 39 | 2.0% | 249 | 3.2% | $3,645,386 | 2.1% | 55 | 2.8% | 253 | 3.6% | $4,086,397 | 2.9% |
| Natrona | 209 | 10.7% | 729 | 9.3% | $16,290,692 | 9.5% | 251 | 12.6% | 1,161 | 16.6% | $25,350,319 | 17.9% |
| Othersb | 74 | 3.8% | 517 | 6.6% | $9,811,125 | 5.8% | 93 | 4.7% | 599 | 8.6% | $11,948,928 | 8.5% |
| Statewide | 1,945 | 100.0% | 7,801 | 100.0% | $170,598,515 | 100.0% | 1,987 | 100.0% | 6,991 | 100.0% | $141,366,482 | 100.0% |
| aInitial Jobs represent the starting level employment, which is the highest average quarterly employment during the first two quarters a firm is in business. | ||||||||||||
| bOthers include all firms missing county information, having more than one county location (multi-county firms), having a foreign location, and out-of-state firms. | ||||||||||||
| Industry | 2010 | 2011 | ||||||||||
|---|---|---|---|---|---|---|---|---|---|---|---|---|
| New Firms | Initial Jobs | Total Wages | New Firms | Initial Jobs | Total Wages | |||||||
| N | % | N | % | N | % | N | % | N | % | N | % | |
| Agriculture | 30 | 1.5% | 108 | 1.4% | $1,480,093 | 0.9% | 41 | 2.1% | 118 | 1.7% | $2,399,597 | 1.7% |
| Mining | 78 | 4.0% | 330 | 4.2% | $11,870,005 | 7.0% | 86 | 4.3% | 512 | 7.3% | $19,750,164 | 14.0% |
| Utilities | 4 | 0.2% | 5 | 0.1% | $319,059 | 0.2% | 3 | 0.2% | 8 | 0.1% | $97,027 | 0.1% |
| Construction | 359 | 18.5% | 1,952 | 25.0% | $52,733,663 | 30.9% | 310 | 15.6% | 1,480 | 21.2% | $25,915,575 | 18.3% |
| Manufacturing | 30 | 1.5% | 111 | 1.4% | $1,489,763 | 0.9% | 40 | 2.0% | 101 | 1.4% | $1,962,663 | 1.4% |
| Wholesale Trade | 85 | 4.4% | 201 | 2.6% | $17,465,163 | 10.2% | 90 | 4.5% | 149 | 2.1% | $4,132,687 | 2.9% |
| Retail Trade | 104 | 5.3% | 319 | 4.1% | $2,374,876 | 1.4% | 96 | 4.8% | 339 | 4.8% | $3,659,525 | 2.6% |
| Transp. & Warehousing | 81 | 4.2% | 210 | 2.7% | $4,182,423 | 2.5% | 120 | 6.0% | 286 | 4.1% | $7,976,960 | 5.6% |
| Information | 21 | 1.1% | 91 | 1.2% | $2,469,069 | 1.4% | 27 | 1.4% | 33 | 0.5% | $1,028,848 | 0.7% |
| Finance & Insurance | 93 | 4.8% | 84 | 1.1% | $2,754,161 | 1.6% | 79 | 4.0% | 76 | 1.1% | $4,767,967 | 3.4% |
| Real Estate & Rental & Leasing | 82 | 4.2% | 153 | 2.0% | $3,598,472 | 2.1% | 64 | 3.2% | 104 | 1.5% | $6,459,666 | 4.6% |
| Prof. & Technical Services | 288 | 14.8% | 487 | 6.2% | $15,468,164 | 9.1% | 299 | 15.0% | 520 | 7.4% | $20,029,883 | 14.2% |
| Mgmt.of Companies & Enterprises | 7 | 0.4% | 15 | 0.2% | $3,618,655 | 2.1% | 6 | 0.3% | 26 | 0.4% | $2,067,689 | 1.5% |
| Admin. & Waste Services | 171 | 8.8% | 593 | 7.6% | $7,627,966 | 4.5% | 175 | 8.8% | 639 | 9.1% | $13,784,372 | 9.8% |
| Educational Services | 33 | 1.7% | 66 | 0.8% | $636,809 | 0.4% | 29 | 1.5% | 56 | 0.8% | $803,150 | 0.6% |
| Health Care & Social Asst. | 128 | 6.6% | 805 | 10.3% | $23,986,659 | 14.1% | 134 | 6.7% | 647 | 9.3% | $13,229,930 | 9.4% |
| Arts, Ent., & Recreation | 20 | 1.0% | 175 | 2.2% | $1,096,021 | 0.6% | 30 | 1.5% | 137 | 2.0% | $820,157 | 0.6% |
| Accommodation & Food Services | 137 | 7.0% | 1,678 | 21.5% | $12,062,654 | 7.1% | 141 | 7.1% | 1,370 | 19.6% | $7,107,042 | 5.0% |
| Other Services | 191 | 9.8% | 385 | 4.9% | $3,959,600 | 2.3% | 212 | 10.7% | 382 | 5.5% | $5,139,818 | 3.6% |
| Government | 3 | 0.2% | 33 | 0.4% | $1,405,240 | 0.8% | 5 | 0.3% | 8 | 0.1% | $233,762 | 0.2% |
| Total | 1,945 | 100.0% | 7,801 | 100.0% | $170,598,515 | 100.0% | 1,987 | 100.0% | 6,991 | 100.0% | $141,366,482 | 100.0% |
| Industry | Region Shares of Industry Total (Row Percent) | Statewide Total | ||||||
|---|---|---|---|---|---|---|---|---|
| Northwest | Northeast | Southwest | Southeast | Central | Other* | N | % | |
| Agriculture | 23.9% | 28.2% | 16.9% | 25.4% | 5.6% | 0.0% | 71 | 1.8% |
| Mining | 9.8% | 22.6% | 21.3% | 11.6% | 26.8% | 7.9% | 164 | 4.2% |
| Utilities | N/A | N/A | N/A | N/A | N/A | N/A | 7 | 0.2% |
| Construction | 13.3% | 19.4% | 21.1% | 25.4% | 16.1% | 4.6% | 669 | 17.0% |
| Manufacturing | 18.6% | 24.3% | 24.3% | 17.1% | 12.9% | 2.9% | 70 | 1.8% |
| Wholesale Trade | 13.1% | 17.7% | 20.6% | 19.4% | 22.3% | 6.9% | 175 | 4.5% |
| Retail Trade | 11.0% | 18.5% | 33.0% | 22.0% | 13.5% | 2.0% | 200 | 5.1% |
| Transportation & Warehousing | 15.9% | 12.9% | 27.9% | 19.4% | 20.4% | 3.5% | 201 | 5.1% |
| Information | 14.6% | 4.2% | 29.2% | 22.9% | 10.4% | 18.8% | 48 | 1.2% |
| Finance & Insurance | 8.1% | 3.5% | 41.3% | 27.3% | 10.5% | 9.3% | 172 | 4.4% |
| Real Estate & Rental & Leasing | 9.6% | 16.4% | 28.8% | 25.3% | 19.9% | 0.0% | 146 | 3.7% |
| Professional & Technical Services | 14.1% | 10.2% | 23.5% | 29.8% | 17.4% | 4.9% | 587 | 14.9% |
| Mgmt.of Companies & Enterprises | 7.7% | 38.5% | 23.1% | 23.1% | 7.7% | 0.0% | 13 | 0.3% |
| Administrative & Waste Services | 9.2% | 14.5% | 23.1% | 30.1% | 15.0% | 8.1% | 346 | 8.8% |
| Educational Services | 12.9% | 12.9% | 22.6% | 32.3% | 12.9% | 6.5% | 62 | 1.6% |
| Health Care & Social Assistance | 19.1% | 17.2% | 20.2% | 25.2% | 17.2% | 1.1% | 262 | 6.7% |
| Arts, Entertainment, & Recreation | 12.0% | 10.0% | 46.0% | 12.0% | 18.0% | 2.0% | 50 | 1.3% |
| Accommodation & Food Services | 21.2% | 13.3% | 29.1% | 18.3% | 16.9% | 1.1% | 278 | 7.1% |
| Other Services | 13.9% | 19.9% | 30.3% | 20.8% | 14.4% | 0.7% | 403 | 10.2% |
| Government | N/A | N/A | N/A | N/A | N/A | N/A | 8 | 0.2% |
| Total | 13.8% | 15.9% | 25.6% | 24.0% | 16.5% | 4.2% | 3,932 | 100.0% |
| *Other includes all firms missing county information, having more than one county location (multi-county firms), having a foreign location, and out-of-state firms. | ||||||||
| N/A = not available due to confidentiality requirement. | ||||||||
| Industry | 2000 | 2001 | 2002 | 2003 | 2004 | 2005 | 2006 | 2007 | 2008 | 2009 | 2010 | 2011 |
|---|---|---|---|---|---|---|---|---|---|---|---|---|
| Agriculture | 8.8% | 10.7% | 8.0% | 8.0% | 7.7% | 7.6% | 8.6% | 7.0% | 7.2% | 8.4% | 6.7% | 8.9% |
| Mining | 13.4% | 19.2% | 10.2% | 10.4% | 10.9% | 11.0% | 13.6% | 9.3% | 9.0% | 5.8% | 6.9% | 7.6% |
| Utilities | 4.3% | 2.2% | 3.2% | 8.2% | 1.0% | 3.1% | 3.0% | 4.0% | 3.8% | 1.7% | 3.3% | 2.5% |
| Construction | 13.6% | 12.7% | 14.0% | 12.2% | 13.2% | 13.5% | 15.7% | 16.0% | 12.8% | 10.2% | 9.5% | 8.6% |
| Manufacturing | 9.8% | 9.2% | 7.0% | 8.5% | 5.1% | 7.7% | 8.6% | 8.5% | 5.0% | 5.7% | 5.0% | 6.6% |
| Wholesale Trade | 10.6% | 11.5% | 7.7% | 8.6% | 9.2% | 10.4% | 9.0% | 8.6% | 7.1% | 5.5% | 6.7% | 7.0% |
| Retail Trade | 6.0% | 5.7% | 6.0% | 6.4% | 5.6% | 5.8% | 4.5% | 5.1% | 4.8% | 3.2% | 4.1% | 3.8% |
| Transportation & Warehousing | 13.7% | 11.4% | 13.9% | 10.8% | 12.0% | 14.5% | 14.1% | 12.1% | 13.6% | 8.4% | 8.2% | 11.8% |
| Information | 9.8% | 9.5% | 7.2% | 5.4% | 7.6% | 6.9% | 7.8% | 5.8% | 6.7% | 6.3% | 5.8% | 7.5% |
| Finance & Insurance | 8.6% | 6.3% | 7.2% | 7.3% | 6.2% | 8.1% | 7.3% | 8.0% | 7.0% | 6.5% | 8.3% | 7.0% |
| Real Estate & Rental & Leasing | 9.7% | 8.4% | 9.1% | 8.8% | 10.0% | 11.3% | 8.6% | 9.1% | 8.6% | 5.5% | 7.8% | 6.1% |
| Professional & Technical Services | 11.6% | 13.6% | 10.8% | 11.4% | 14.1% | 13.6% | 13.4% | 12.9% | 12.6% | 9.7% | 11.5% | 11.6% |
| Mgmt.of Companies & Enterprises | 14.3% | 9.9% | 12.5% | 17.9% | 16.7% | 11.9% | 11.6% | 6.0% | 7.1% | 8.0% | 5.3% | 4.6% |
| Administrative & Waste Services | 17.7% | 14.4% | 14.4% | 13.4% | 15.9% | 12.5% | 13.4% | 14.4% | 15.3% | 13.8% | 12.3% | 12.3% |
| Educational Services | 15.3% | 13.2% | 23.3% | 20.0% | 14.6% | 14.4% | 15.1% | 17.6% | 9.8% | 15.1% | 17.1% | 13.9% |
| Health Care & Social Assistance | 6.2% | 7.3% | 8.3% | 7.2% | 8.1% | 8.2% | 7.7% | 7.3% | 7.9% | 8.6% | 7.0% | 7.2% |
| Arts, Entertainment, & Recreation | 8.0% | 9.2% | 7.5% | 6.9% | 10.6% | 9.1% | 4.5% | 6.4% | 7.5% | 6.0% | 5.1% | 7.6% |
| Accommodation & Food Services | 7.9% | 8.0% | 7.0% | 7.0% | 7.7% | 7.2% | 7.6% | 7.0% | 5.8% | 5.9% | 7.4% | 7.5% |
| Other Services | 10.3% | 11.2% | 8.9% | 10.1% | 9.4% | 9.7% | 10.6% | 11.0% | 10.9% | 8.2% | 11.1% | 11.8% |
| Total | 10.3% | 10.4% | 9.7% | 9.4% | 10.0% | 10.2% | 10.4% | 10.2% | 9.5% | 7.8% | 8.3% | 8.4% |
|
Industry |
One Year |
Two Year |
Three Year |
Four Year |
Five Year |
10 Year |
|---|---|---|---|---|---|---|
|
Agriculture |
78.2% |
68.2% |
60.4% |
54.3% |
49.9% |
33.8% |
|
Mining |
73.4% |
60.6% |
50.4% |
44.8% |
39.2% |
21.0% |
|
Utilities |
71.9% |
59.0% |
57.9% |
54.7% |
55.1% |
40.0% |
|
Construction |
57.6% |
44.0% |
36.0% |
29.7% |
25.9% |
14.0% |
|
Manufacturing |
72.6% |
60.1% |
51.1% |
45.8% |
39.7% |
21.8% |
|
Wholesale Trade |
73.8% |
57.0% |
46.7% |
39.1% |
33.7% |
17.5% |
|
Retail Trade |
74.5% |
59.6% |
49.2% |
42.1% |
35.1% |
17.9% |
|
Transportation & Warehousing |
68.0% |
54.3% |
44.1% |
37.1% |
32.5% |
17.9% |
|
Information |
66.2% |
51.5% |
44.2% |
37.1% |
31.1% |
13.4% |
|
Finance & Insurance |
69.0% |
56.9% |
47.3% |
41.8% |
38.4% |
24.5% |
|
Real Estate & Rental & Leasing |
76.5% |
65.3% |
56.9% |
50.6% |
45.9% |
29.4% |
|
Professional & Technical Services |
71.6% |
57.8% |
48.2% |
42.1% |
37.0% |
21.7% |
|
Mgmt.of Companies & Enterprises |
76.0% |
59.9% |
55.1% |
43.7% |
39.1% |
29.3% |
|
Administrative & Waste Services |
63.7% |
51.1% |
40.9% |
33.7% |
28.5% |
15.9% |
|
Educational Services |
72.7% |
60.5% |
52.3% |
43.6% |
36.0% |
17.9% |
|
Health Care & Social Assistance |
83.0% |
70.7% |
62.2% |
54.6% |
48.5% |
31.0% |
|
Arts, Entertainment, & Recreation |
69.6% |
57.4% |
48.1% |
40.8% |
35.6% |
19.0% |
|
Accommodation & Food Services |
73.0% |
56.5% |
47.9% |
40.1% |
34.7% |
17.2% |
|
Other Services |
67.7% |
51.2% |
41.7% |
34.7% |
29.6% |
14.9% |
|
Total |
68.9% |
55.0% |
45.9% |
39.2% |
34.2% |
19.1% |
| Industry | Northwest | Northeast | Southwest | Southeast | Central | Nonclassified | Statewide |
|---|---|---|---|---|---|---|---|
| Agriculture | 76.0% | 71.9% | 72.3% | 85.9% | 88.3% | 62.5% | 78.2% |
| Mining | 71.5% | 75.8% | 74.5% | 71.4% | 70.6% | 70.3% | 73.4% |
| Utilities | 100.0% | 66.7% | 69.2% | 81.8% | 54.5% | 50.0% | 71.9% |
| Construction | 56.6% | 59.8% | 57.6% | 57.1% | 60.2% | 43.8% | 57.6% |
| Manufacturing | 66.8% | 79.0% | 74.9% | 70.6% | 73.3% | 69.2% | 72.6% |
| Wholesale Trade | 73.2% | 76.8% | 70.6% | 77.4% | 73.6% | 69.7% | 73.8% |
| Retail Trade | 73.8% | 76.1% | 76.0% | 73.3% | 74.2% | 63.5% | 74.5% |
| Transportation & Warehousing | 69.1% | 70.1% | 66.3% | 68.8% | 66.6% | 69.4% | 68.0% |
| Information | 71.7% | 73.7% | 66.1% | 64.6% | 62.3% | 61.4% | 66.2% |
| Finance & Insurance | 67.4% | 74.8% | 72.6% | 68.0% | 74.6% | 41.9% | 69.0% |
| Real Estate & Rental & Leasing | 74.5% | 78.7% | 74.7% | 78.2% | 79.1% | 57.9% | 76.5% |
| Professional & Technical Services | 72.9% | 72.0% | 72.7% | 72.3% | 74.1% | 50.7% | 71.6% |
| Mgmt.of Companies & Enterprises | 70.4% | 88.5% | 84.0% | 60.5% | 81.8% | 50.0% | 76.0% |
| Administrative & Waste Services | 63.3% | 65.7% | 65.0% | 65.5% | 62.9% | 56.1% | 63.7% |
| Educational Services | 72.3% | 78.0% | 74.3% | 72.6% | 72.9% | 59.3% | 72.7% |
| Health Care & Social Assistance | 83.0% | 83.8% | 83.3% | 83.4% | 82.8% | 72.5% | 83.0% |
| Arts, Entertainment, & Recreation | 65.9% | 71.4% | 74.6% | 69.2% | 67.5% | 43.8% | 69.6% |
| Accommodation & Food Services | 70.5% | 72.2% | 72.5% | 76.0% | 73.8% | 76.2% | 73.0% |
| Other Services | 65.8% | 69.2% | 70.7% | 64.1% | 69.5% | 61.4% | 67.7% |
| Total | 68.4% | 70.6% | 68.9% | 69.0% | 70.5% | 56.8% | 68.9% |