
Understanding Wyoming’s Growing Education and Employment Database
The purpose of this article is to familiarize readers with new data available from Research & Planning that helps answer questions about education and employment in Wyoming.
In 2013, the Research & Planning (R&P) section of the Wyoming Department of Workforce Services received a Workforce Data Quality Initiative (WDQI) Grant from the Employment and Training Administration of the U.S. Department of Labor for the purposes of building and maintaining a longitudinal database profiling the state workforce. Through the grant, R&P has established memorandums of understanding with the Wyoming Department of Education, the University of Wyoming, and the Wyoming Community College Commission to facilitate the use of student records. In addition, R&P has data sharing agreements with the Wyoming Department of Transportation, and the labor market information offices of 11 other states in order to develop a more accurate understanding of labor market behavior.
R&P’s first report produced under the grant, titled Workforce Data Quality Initiative Report No. 1 for Wyoming: School Attendance and Employment, 2006 to 2013 (WDQI #1), focused on high school students’ interactions with the labor market, including earnings and post-secondary enrollment in the years prior to anticipated graduation, and the years following the exit from high school. It is possible to explore the data using multiple categories, such as cohort year (or the year of anticipated graduation, i.e. 2009/10), geographic area (including by county, region, and statewide), gender, and completion status (that is, whether or not R&P can assume the student received a diploma). For a map of the geographic areas, please see the cover of WDQI #1: Appendix A (http://doe.state.wy.us/LMI/education_we_connect/WDQI_Pub1_Appendix_A.pdf).
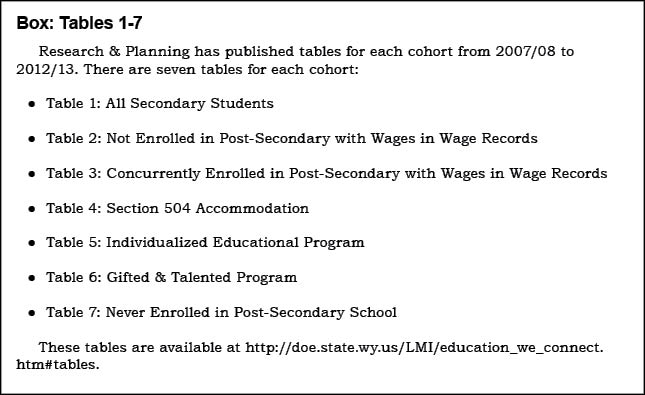 |
R&P has categorized the data into seven tables, each with its own subcategories, in order to make the data more accessible (see Box). The tables referenced in this article are available online at http://doe.state.wy.us/LMI/education_we_connect.htm#tables.
A more detailed explanation of the database can be found in Chapter 4 of WDQI #1 (http://doe.state.wy.us/LMI/education_we_connect/WDQI_Pub1.pdf).
Understanding the Layout of the Database
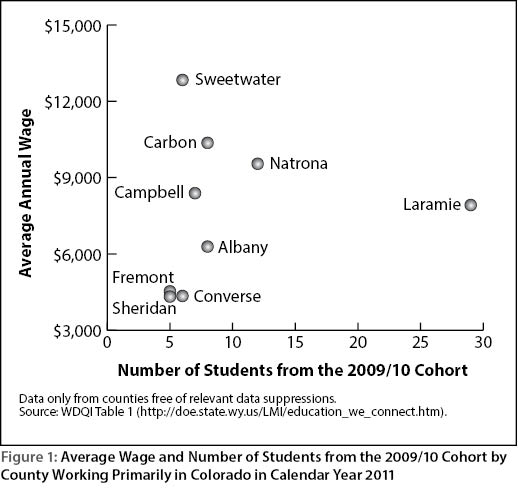 |
Table 1 uses the previously mentioned categories (cohort year, gender, geographic area, completion status, and others) to sort all secondary students found in Wyoming. Figure 1 uses data collected from Table 1 to answer the question, “How many students from Laramie County work in Colorado in the year following graduation, and how much do they earn?” As shown in Figure 1, 29 students from the 2009/10 cohort in Laramie County worked in Colorado in the year following graduation, with average annual earnings of $7,921. Laramie County had the most students of any Wyoming county working in Colorado, but students from Sweetwater, Carbon, Natrona, and Campbell counties who worked in Colorado had higher wages.
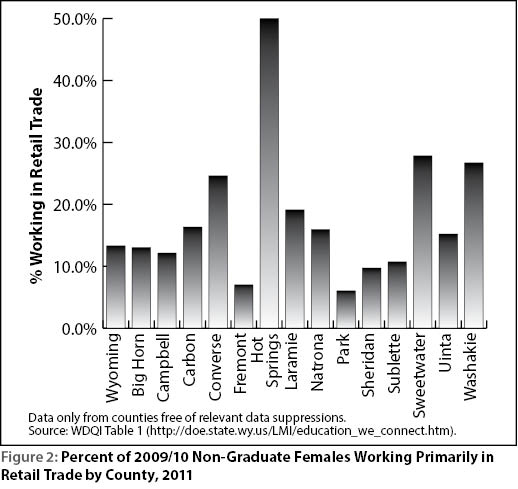 |
Figure 2 uses data from Table 1 to answer the question, “Which county has the highest percentage of non-graduate females who work primarily in retail trade the following year?” Figure 2 shows that 50% of female non-graduates from Hot Springs County in the 2009/10 cohort worked in the retail trade industry one year after what would have been their graduation year.
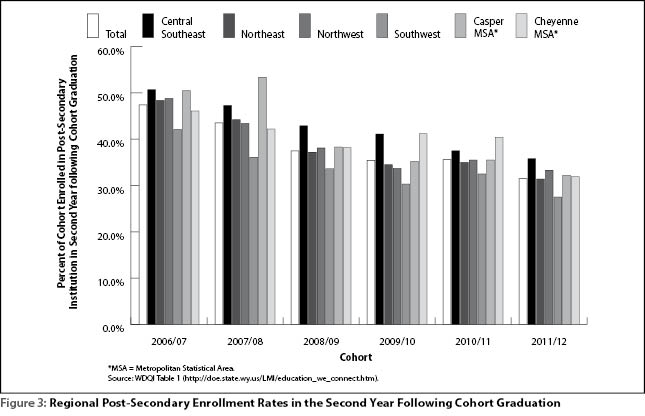 |
Figure 3 uses data from Table 1 to answer the question, “In the second year following graduation, does the central southeast region of the state have higher post-secondary enrollment rates than the state as a whole, and does this change over time?” As shown in Figure 3, post-secondary enrollment of students from Wyoming’s central southeast region was usually higher than other regions for most cohorts.
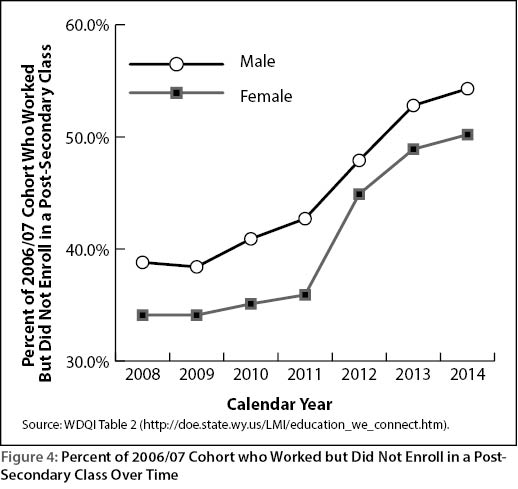 |
While Table 1 provides data on all high school students, other tables show data for groups of secondary students with specific characteristics. Table 2, titled “Not Enrolled in Post-Secondary with Wages in Wage Records,” takes all secondary students (by cohort year, geographic area, gender, and completion status) and shows the data for students who worked but were not enrolled in any post-secondary classes during a given year. Using Table 2, it would be possible to determine the percent of females in Wyoming who worked but did not enroll in a post-secondary class in the year following anticipated graduation and compare it to their male equivalents. This is illustrated in Figure 4, which shows that males and females followed a fairly similar pattern over time, but a higher percentage of males worked but did not enroll in any post-secondary classes.
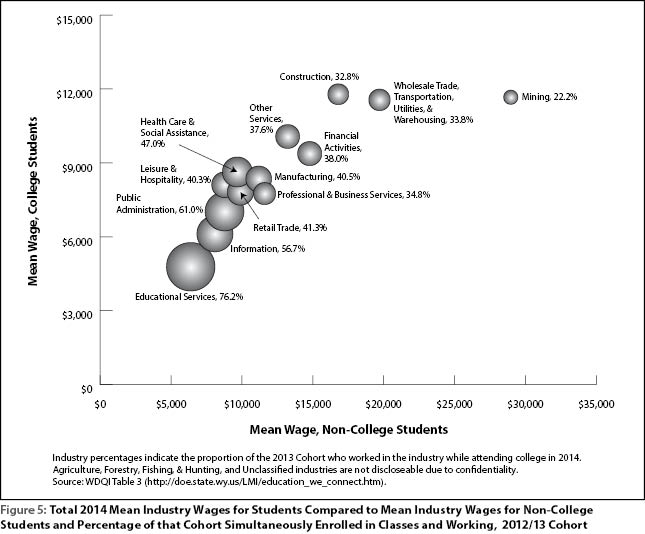 |
Table 3, similar to Table 2, is titled “Concurrently Enrolled in Post-Secondary with Wages in Wage Records.” Table 3 displays the information for the group of students who worked while attending college in a given year. If one wanted to know how the mean wage in a given industry for working college students compared to the mean wage in the same industry for their unenrolled counterparts, or which industry has the highest percentage of workers simultaneously enrolled in college, Table 3 could help answer these questions. Figure 5 shows that those individuals from the 2012/13 cohort who were not enrolled in post-secondary classes earned considerably more in the mining industry than those who were simultaneously enrolled in college and working in mining. Figure 5 also shows that only 22.2% of individuals from the 2012/13 cohort who worked in mining were enrolled in college at the same time.
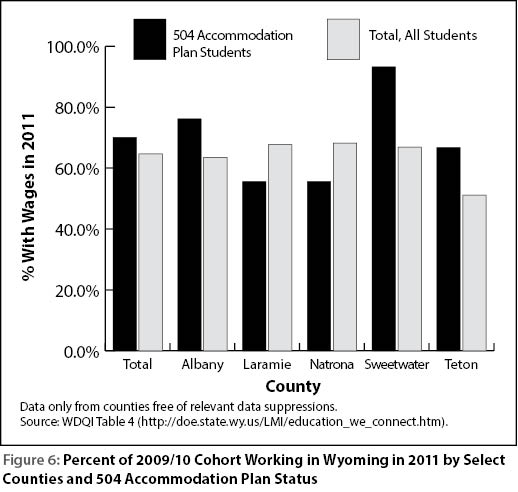 |
Wages and post-secondary enrollment for students who were enrolled at any point in a Section 504 Vocational Rehabilitation accommodation plan (Section 504), an Individualized Educational Program (IEP), and in their district’s Gifted & Talented (GT) Program are found in the respective tables 4, 5, and 6. Comparing the three tables could answer questions such as “Are Section 504 students in Teton County more or less likely than the all secondary students in the state to work in the state of Wyoming after the cohort’s graduation?” This is illustrated in Figure 6, which shows that 66.7% of Teton County students with a 504 plan from the 2009/10 cohort were working in Wyoming in 2011, compared to 51.1% of all students from Teton County.
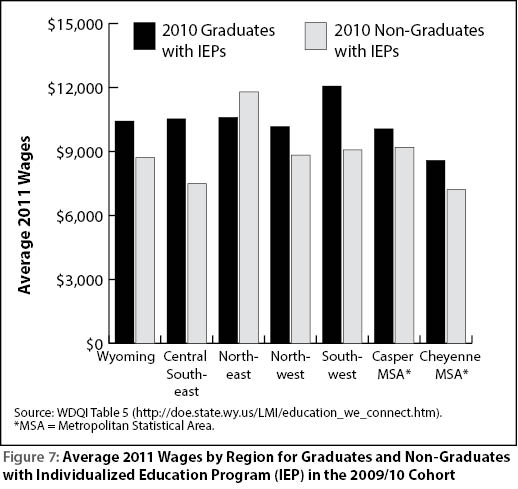 |
Figure 7 uses data from Table 5 to address the question, “Are wages in the year following anticipated graduation different between students who had an IEP and graduated compared to the related non-graduates?” Figure 7 shows that in 2011, graduates with IEPs from the 2009/10 cohort earned more than non-graduates with IEPs in every Wyoming region except the northeast. More information concerning students with IEPs and students with a Section 504 accommodation plan can be found in Chapter 3 of WDQI #1, “Outcomes for Students with Disabilities.”
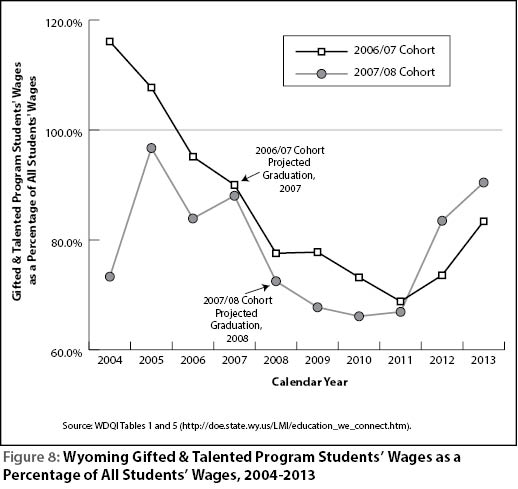 |
What are the average wage differences between students overall and students who participated in the GT Program? This question can be answered by looking at Figure 8, which was constructed using data from tables 1 and 5. Figure 8 shows the average earnings of students who participated in the GT program as a percentage of the average earnings of all students from the 2006/07 and 2007/08 cohorts. Figure 8 shows that average wages for GT students were lower than average wages for all students during the four years after projected high school graduation, but then began to increase. This may be representative of GT students earning less while enrolled in a postsecondary program, and then experiencing a wage increase after completion of the postsecondary program.
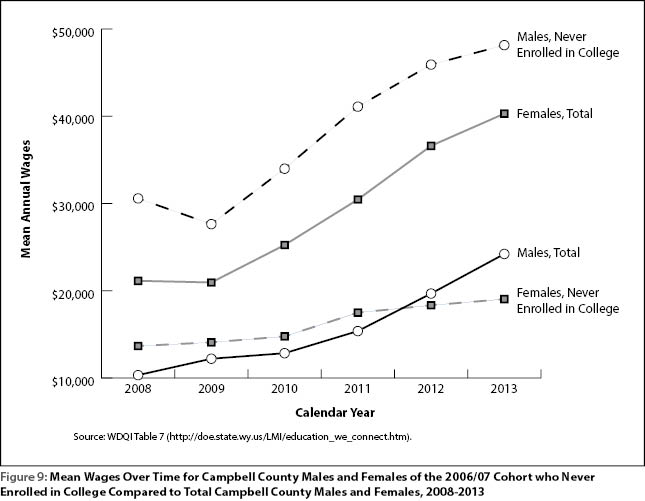 |
Table 7 is similar to Table 1, but only shows data for students who were never enrolled in college for the years in which R&P has data, (2007-2014). Wages and state of employment for those with no college experience can be compared, over time, to Table 1. If one wanted to know how much male Campbell County high school students make if they never attended college compared to the wages of male Campbell County high school students overall, Table 7 could help answer that question. This is illustrated in Figure 9, which shows that the average wage for Campbell County males who never enrolled in college was considerably higher than the average wage for all males from Campbell County. However, the opposite was true for females from Campbell County: the average wage of all females from Campbell County was substantially higher than the average wage for Campbell County females who never enrolled in college.
Database Limitations
There are a number of limitations to the data discussed here. First, it is important to note that not all cohort year participants are graduates. Cohort year only indicates that the specified year is the year in which the student would have graduated. For example, cohort year 2009/10 means R&P anticipated that the student would have graduated in the spring of 2010. A student with an indicated cohort year of 2009/10 may not have participated throughout all of high school, or the whole of their senior year; a student could graduated early, dropped out, died, or left the state to complete high school elsewhere.
Second, R&P’s ability to determine completion status has changed over time. Prior to the exit of the 2009/10 cohort from secondary school, R&P does not have information concerning exactly which groups of students received diplomas. For the 2006/07, 2007/08, and 2008/09 cohorts, graduation rates are calculated by assuming a student who participated in high school in March of their graduation year received a diploma. Though there are many drawbacks to this assumption, it is the best alternative available from the most recent data received for the above-mentioned groups. For the cohorts after and including 2009/10, R&P defines high school graduates as students who “graduated with a Wyoming regular high school diploma AND completed district defined college-bound course of study” or “graduated with a Wyoming regular high school diploma but without having completed the district defined college-bound course of study” (Wuerth, 2013). All others are considered non-graduates.
Finally, suppressions to protect anonymity also limit the data. If a cell has less than five observations, including zero, the cell is blacked out. This means related cells may also be suppressed in order to prevent someone from back-calculating the value of a field. Table 5 contains an example of suppression: for the state’s entire 2009/10 cohort, the number of students who had IEPs at one point and worked in Colorado during the calendar year 2010 is blocked from view, as is the corresponding mean annual wage. Suppressions are more likely to occur as tables become more specific to a geographic area, gender, or completion status.
Through the Workforce Data Quality Initiative Grant from the Employment and Training Administration of the U.S. Department of Labor, R&P is developing one of the most extensive longitudinal education and workforce databases in the country, fostering ongoing data exchanges with the Wyoming Department of Education, the National Student Clearinghouse, the Wyoming Department of Transportation, and the Unemployment Insurance systems of 11 other states.
Within the limits of confidentiality, the data discussed in this paper are available for public use, allowing anyone interested in the progress of Wyoming high school students to explore the data by cohort year, geographic area, gender, and high school completion status. Further details discussing methodology, job stability, income inequality, labor market participation, economic and social mobility, and outcomes of students with disabilities can be found in WDQI #1 at http://doe.state.wy.us/LMI/education_we_connect/WDQI_Pub1.pdf.
References
Gallagher, T., Glover, T., Hammer, L., Holmes, M., & Moore, M. (2013, April). Workforce Data Quality Initiative report no. 1 for Wyoming: Appendix A: Region-level data. In Wyoming labor market information. Retrieved from http://doe.state.wy.us/LMI/education_we_connect/WDQI_Pub1_Appendix_A.pdf
Gallagher, T., Glover, T., Hammer, L., Holmes, M., & Moore, M. (2013, April). Workforce Data Quality Initiative report no. 1 for Wyoming: Appendix B: County-level data. In Wyoming labor market information. Retrieved from http://doe.state.wy.us/LMI/education_we_connect/WDQI_Pub1_Appendix_B.pdf
Gallagher, T., Glover, T., Hammer, L., Holmes, M., & Moore, M. (2013, April). Workforce Data Quality Initiative report no. 1 for Wyoming: School attendance and employment, 2006 to 2013. In Wyoming labor market information. Retrieved from http://doe.state.wy.us/LMI/education_we_connect/WDQI_Pub1.pdf
Wuerth, B. (2013). WDE684 data collection Guidebook. Wyoming department of education. Retrieved from http://portals.edu.wyoming.gov/WISE/sf-docs/spring-2015/wde684-guidebook-end-of-year-2015-v1.pdf?sfvrsn=4