by: David Bullard, Senior Economist
		    tables by: Nancy Brennan, Senior Economist 
			See Related Article
			Tables 1, 2, 3, 4, 5, 6, 7
			  Figures 
			    1, 2, 3


			  Table 1: Percentage Change in Wyoming Covered Employment and Wages for Third Quarter 2009 (2009Q3) to Third Quarter 2013 (2013Q3) 


						| 
							
						 | 
						
							Average Monthly Employment Percentage Change Over the Previous
						 | 
						
							Total Wages Percentage Change Over the Previous
						 | 
						
							Average Weekly Wage Percentage Change Over the Previous
						 | 
			  
					
						| 
							Year
						 | 
						
							Quarter
						 | 
						
							Year
						 | 
						
							Quarter
						 | 
						
							Year
						 | 
						
							Quarter
						 | 


						| aPreliminary.  | 
					
					
						| 
							Source: Quarterly Census of Employment and Wages, developed through a cooperative program between Research & Planning and the U.S. Bureau of Labor Statistics.
					   | 
				  
					
						| 
							Extract date: January 2014.
					   | 


						| 
							2009Q3
						 | 
						
							-5.3
						 | 
						
							0.1
						 | 
						
							-8.4
						 | 
						
							-1.3
						 | 
						
							-3.2
						 | 
						
							-1.5
						 | 
			  
					
						| 
							2010Q3
						 | 
						
							0.0
						 | 
						
							1.9
						 | 
						
							4.8
						 | 
						
							2.3
						 | 
						
							4.8
						 | 
						
							0.3
						 | 
			  
					
						| 
							2011Q3
						 | 
						
							1.4
						 | 
						
							2.6
						 | 
						
							6.5
						 | 
						
							4.1
						 | 
						
							5.0
						 | 
						
							1.5
						 | 
			  
					
						| 
							2012Q3
						 | 
						
							0.7
						 | 
						
							1.1
						 | 
						
							0.2
						 | 
						
							-0.5
						 | 
						
							-0.5
						 | 
						
							-1.5
						 | 
			  
					
						| 
						2013Q3a | 
						
							0.4
						 | 
						
							1.3
						 | 
						
							2.1
						 | 
						
							1.1
						 | 
						
							1.7
						 | 
						
							-0.3
						 | 
			  
					
						| 
							Five-Year Average for Q3
						 | 
						
							-0.6
						 | 
						
							1.4
						 | 
						
							1.1
						 | 
						
							1.1
						 | 
						
							1.6
						 | 
						
							-0.3
						 | 
			  
					
						|  
							
					     | 


			Table 2: Salaries & Wages as a Percentage of All Income by Age, Tax Year 2011 


						| 
							Age
						Group | 
						
							%
						 | 
					
					
						| 
							All Returns
						 | 
						
							71.3%
						 | 
					
					
						| 
							under 18
						 | 
						
							72.1%
						 | 
					
					
						| 
							18-24
						 | 
						
							93.1%
						 | 
					
					
						| 
							25-34
						 | 
						
							91.4%
						 | 
					
					
						| 
							35-44
						 | 
						
							85.8%
						 | 
					
					
						| 
							45-54
						 | 
						
							79.7%
						 | 
					
					
						| 
							55-64
						 | 
						
							66.8%
						 | 
					
					
						| 
							65 and over
						 | 
						
							22.9%
						 | 
					
					
						|  
							
					   | 
					
					
						| 
							Source: Calculated from Table 1.5, IRS Statistics of Income Division
						 | 


			Table 3: Over-the-Year Percentage Change in Wyoming Covered Employment and Wages for Third Quarter 2004 (2004Q3) to Third Quarter 2013 (2013Q3) 


						| 
							
						 | 
						
							Average Monthly Employment
						 | 
						
							Total Wages
						 | 


						|  
							
						 | 
					
					
						| aPreliminary.  | 
					
					
						| 
							Source: Quarterly Census of Employment and Wages, developed through a cooperative program between Research & Planning and the U.S. Bureau of Labor Statistics.
						 | 
					
					
						| 
							Extract date: January 2014.
						 | 


						| 
							2004Q3
						 | 
						
							2.0
						 | 
						
							7.1
						 | 
					
					
						| 
							2004Q4
						 | 
						
							2.4
						 | 
						
							6.5
						 | 
					
					
						| 
							2005Q1
						 | 
						
							1.9
						 | 
						
							6.6
						 | 
					
					
						| 
							2005Q2
						 | 
						
							2.1
						 | 
						
							8.3
						 | 
					
					
						| 
							2005Q3
						 | 
						
							2.7
						 | 
						
							11.7
						 | 
					
					
						| 
							2005Q4
						 | 
						
							3.4
						 | 
						
							10.1
						 | 
					
					
						| 
							2006Q1
						 | 
						
							5.1
						 | 
						
							15.1
						 | 
					
					
						| 
							2006Q2
						 | 
						
							5.0
						 | 
						
							15.5
						 | 
					
					
						| 
							2006Q3
						 | 
						
							4.6
						 | 
						
							14.8
						 | 
					
					
						| 
							2006Q4
						 | 
						
							5.1
						 | 
						
							17.1
						 | 
					
					
						| 
							2007Q1
						 | 
						
							4.8
						 | 
						
							14.5
						 | 
					
					
						| 
							2007Q2
						 | 
						
							3.9
						 | 
						
							12.4
						 | 
					
					
						| 
							2007Q3
						 | 
						
							3.7
						 | 
						
							8.0
						 | 
					
					
						| 
							2007Q4
						 | 
						
							3.8
						 | 
						
							11.3
						 | 
					
					
						| 
							2008Q1
						 | 
						
							3.6
						 | 
						
							10.6
						 | 
					
					
						| 
							2008Q2
						 | 
						
							3.1
						 | 
						
							8.7
						 | 
					
					
						| 
							2008Q3
						 | 
						
							3.4
						 | 
						
							10.1
						 | 
					
					
						| 
							2008Q4
						 | 
						
							2.4
						 | 
						
							6.8
						 | 
					
					
						| 
							2009Q1
						 | 
						
							-1.0
						 | 
						
							-1.2
						 | 
					
					
						| 
							2009Q2
						 | 
						
							-3.4
						 | 
						
							-5.0
						 | 
					
					
						| 
							2009Q3
						 | 
						
							-5.3
						 | 
						
							-8.4
						 | 
					
					
						| 
							2009Q4
						 | 
						
							-6.3
						 | 
						
							-8.4
						 | 
					
					
						| 
							2010Q1
						 | 
						
							-4.7
						 | 
						
							-4.9
						 | 
					
					
						| 
							2010Q2
						 | 
						
							-1.7
						 | 
						
							1.1
						 | 
					
					
						| 
							2010Q3
						 | 
						
							0.0
						 | 
						
							4.8
						 | 
					
					
						| 
							2010Q4
						 | 
						
							1.1
						 | 
						
							6.0
						 | 
					
					
						| 
							2011Q1
						 | 
						
							1.1
						 | 
						
							5.4
						 | 
					
					
						| 
							2011Q2
						 | 
						
							0.8
						 | 
						
							4.7
						 | 
					
					
						| 
							2011Q3
						 | 
						
							1.4
						 | 
						
							6.5
						 | 
					
					
						| 
							2011Q4
						 | 
						
							2.0
						 | 
						
							2.5
						 | 
					
					
						| 
							2012Q1
						 | 
						
							2.5
						 | 
						
							8.0
						 | 
					
					
						| 
							2012Q2
						 | 
						
							2.2
						 | 
						
							4.8
						 | 
					
					
						| 
							2012Q3
						 | 
						
							0.7
						 | 
						
							0.2
						 | 
					
					
						| 
							2012Q4
						 | 
						
							0.3
						 | 
						
							4.1
						 | 
					
					
						| 
							2013Q1
						 | 
						
							0.3
						 | 
						
							1.1
						 | 
					
					
						| 
							2013Q2
						 | 
						
							0.2
						 | 
						
							0.6
						 | 
					
					
						| 
						2013Q3a | 
						
							0.4
						 | 
						
							2.1
						 | 


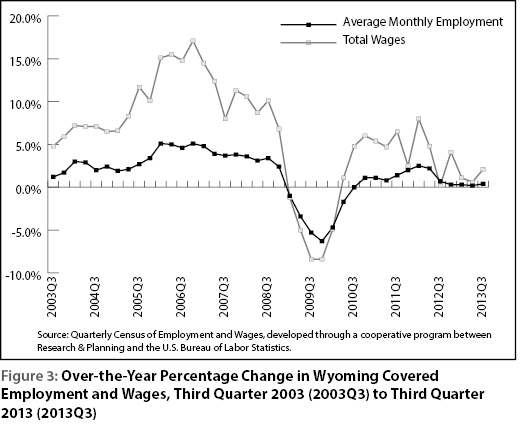
			Table 4: Wyoming Average Monthly Employment, Total Payroll, and Average Weekly Wage for Third Quarter by County, 2012 and 2013a 


						| 
							
						 | 
						
							Average Monthly Employment
						 | 
						
							Total Payroll
						 | 
						
							Average Weekly Wage
						 | 
					
					
						| 
							County
						 | 
						
							Third Quarter
						 | 
						
							Change
						 | 
						
							Third Quarter
						 | 
						
							Change
						 | 
						
							Third Quarter
						 | 
						
							Change
						 | 
					
					
						| 
							2012
						 | 
						
							2013
						 | 
						
							n
						 | 
						
							%
						 | 
						
							2012
						 | 
						
							2013
						 | 
						
							$
						 | 
						
							%
						 | 
						
							2012
						 | 
						
							2013
						 | 
						
							$
						 | 
						
							%
						 | 


						| 
							Total
						 | 
						
							 284,180 
						 | 
						
							 285,450 
						 | 
						
							1,269
						 | 
						
							0.4
						 | 
						
							$3,060,122,560
						 | 
						
							$3,125,831,216
						 | 
						
							$65,708,656
						 | 
						
							2.1
						 | 
						
							$828
						 | 
						
							$842
						 | 
						
							$14
						 | 
						
							1.7
						 | 
					
					
						| 
							Albany
						 | 
						
							 15,228 
						 | 
						
							 15,267 
						 | 
						
							39
						 | 
						
							0.3
						 | 
						
							$140,026,406
						 | 
						
							$141,492,685
						 | 
						
							$1,466,279
						 | 
						
							1.0
						 | 
						
							$707
						 | 
						
							$713
						 | 
						
							$6
						 | 
						
							0.8
						 | 
					
					
						| 
							Big Horn
						 | 
						
							 4,324 
						 | 
						
							 4,338 
						 | 
						
							14
						 | 
						
							0.3
						 | 
						
							 38,153,797 
						 | 
						
							 39,491,951 
						 | 
						
							1,338,154
						 | 
						
							3.5
						 | 
						
							679
						 | 
						
							700
						 | 
						
							21
						 | 
						
							3.1
						 | 
					
					
						| 
							Campbell
						 | 
						
							 27,499 
						 | 
						
							 27,130 
						 | 
						
							-369
						 | 
						
							-1.3
						 | 
						
							 367,608,803 
						 | 
						
							 371,566,993 
						 | 
						
							3,958,190
						 | 
						
							1.1
						 | 
						
							1,028
						 | 
						
							1,054
						 | 
						
							26
						 | 
						
							2.5
						 | 
					
					
						| 
							Carbon
						 | 
						
							 7,111 
						 | 
						
							 7,333 
						 | 
						
							222
						 | 
						
							3.1
						 | 
						
							 71,650,075 
						 | 
						
							 76,625,166 
						 | 
						
							4,975,091
						 | 
						
							6.9
						 | 
						
							775
						 | 
						
							804
						 | 
						
							29
						 | 
						
							3.7
						 | 
					
					
						| 
							Converse
						 | 
						
							 5,881 
						 | 
						
							 5,985 
						 | 
						
							104
						 | 
						
							1.8
						 | 
						
							 64,846,346 
						 | 
						
							 68,104,213 
						 | 
						
							3,257,867
						 | 
						
							5.0
						 | 
						
							848
						 | 
						
							875
						 | 
						
							27
						 | 
						
							3.2
						 | 
					
					
						| 
							Crook
						 | 
						
							 2,376 
						 | 
						
							 2,321 
						 | 
						
							-55
						 | 
						
							-2.3
						 | 
						
							 21,183,137 
						 | 
						
							 22,086,978 
						 | 
						
							903,841
						 | 
						
							4.3
						 | 
						
							686
						 | 
						
							732
						 | 
						
							46
						 | 
						
							6.7
						 | 
					
					
						| 
							Fremont
						 | 
						
							 16,908 
						 | 
						
							 16,721 
						 | 
						
							-187
						 | 
						
							-1.1
						 | 
						
							 163,087,956 
						 | 
						
							 163,352,647 
						 | 
						
							264,691
						 | 
						
							0.2
						 | 
						
							742
						 | 
						
							751
						 | 
						
							9
						 | 
						
							1.2
						 | 
					
					
						| 
							Goshen
						 | 
						
							 4,551 
						 | 
						
							 4,449 
						 | 
						
							-102
						 | 
						
							-2.2
						 | 
						
							 35,544,200 
						 | 
						
							 36,422,101 
						 | 
						
							877,901
						 | 
						
							2.5
						 | 
						
							601
						 | 
						
							630
						 | 
						
							29
						 | 
						
							4.8
						 | 
					
					
						| 
							Hot Springs
						 | 
						
							 2,174 
						 | 
						
							 2,186 
						 | 
						
							12
						 | 
						
							0.6
						 | 
						
							 17,599,864 
						 | 
						
							 18,879,816 
						 | 
						
							1,279,952
						 | 
						
							7.3
						 | 
						
							623
						 | 
						
							664
						 | 
						
							41
						 | 
						
							6.6
						 | 
					
					
						| 
							Johnson
						 | 
						
							 3,424 
						 | 
						
							 3,483 
						 | 
						
							59
						 | 
						
							1.7
						 | 
						
							 27,379,734 
						 | 
						
							 29,443,575 
						 | 
						
							2,063,841
						 | 
						
							7.5
						 | 
						
							615
						 | 
						
							650
						 | 
						
							35
						 | 
						
							5.7
						 | 
					
					
						| 
							Laramie
						 | 
						
							 44,057 
						 | 
						
							 45,640 
						 | 
						
							1,583
						 | 
						
							3.6
						 | 
						
							 456,020,440 
						 | 
						
							 482,429,487 
						 | 
						
							26,409,047
						 | 
						
							5.8
						 | 
						
							796
						 | 
						
							813
						 | 
						
							17
						 | 
						
							2.1
						 | 
					
					
						| 
							Lincoln
						 | 
						
							 5,692 
						 | 
						
							 5,716 
						 | 
						
							24
						 | 
						
							0.4
						 | 
						
							 56,309,862 
						 | 
						
							 57,317,703 
						 | 
						
							1,007,841
						 | 
						
							1.8
						 | 
						
							761
						 | 
						
							771
						 | 
						
							10
						 | 
						
							1.3
						 | 
					
					
						| 
							Natrona
						 | 
						
							 41,256 
						 | 
						
							 41,973 
						 | 
						
							717
						 | 
						
							1.7
						 | 
						
							 483,227,857 
						 | 
						
							 495,036,929 
						 | 
						
							11,809,072
						 | 
						
							2.4
						 | 
						
							901
						 | 
						
							907
						 | 
						
							6
						 | 
						
							0.7
						 | 
					
					
						| 
							Niobrara
						 | 
						
							 925 
						 | 
						
							 924 
						 | 
						
							-1
						 | 
						
							-0.1
						 | 
						
							 6,634,532 
						 | 
						
							 7,214,134 
						 | 
						
							579,602
						 | 
						
							8.7
						 | 
						
							552
						 | 
						
							601
						 | 
						
							49
						 | 
						
							8.9
						 | 
					
					
						| 
							Park
						 | 
						
							 15,549 
						 | 
						
							 15,122 
						 | 
						
							-427
						 | 
						
							-2.7
						 | 
						
							 133,772,441 
						 | 
						
							 140,106,235 
						 | 
						
							6,333,794
						 | 
						
							4.7
						 | 
						
							662
						 | 
						
							713
						 | 
						
							51
						 | 
						
							7.7
						 | 
					
					
						| 
							Platte
						 | 
						
							 3,242 
						 | 
						
							 3,455 
						 | 
						
							213
						 | 
						
							6.6
						 | 
						
							 29,980,952 
						 | 
						
							 33,568,584 
						 | 
						
							3,587,632
						 | 
						
							12.0
						 | 
						
							711
						 | 
						
							747
						 | 
						
							36
						 | 
						
							5.1
						 | 
					
					
						| 
							Sheridan
						 | 
						
							 12,977 
						 | 
						
							 13,134 
						 | 
						
							157
						 | 
						
							1.2
						 | 
						
							 118,289,640 
						 | 
						
							 120,795,968 
						 | 
						
							2,506,328
						 | 
						
							2.1
						 | 
						
							701
						 | 
						
							707
						 | 
						
							6
						 | 
						
							0.9
						 | 
					
					
						| 
							Sublette
						 | 
						
							 5,422 
						 | 
						
							 5,240 
						 | 
						
							-182
						 | 
						
							-3.4
						 | 
						
							 71,995,274 
						 | 
						
							 74,061,954 
						 | 
						
							2,066,680
						 | 
						
							2.9
						 | 
						
							1,021
						 | 
						
							1,087
						 | 
						
							66
						 | 
						
							6.5
						 | 
					
					
						| 
							Sweetwater
						 | 
						
							 24,914 
						 | 
						
							 24,689 
						 | 
						
							-225
						 | 
						
							-0.9
						 | 
						
							 336,023,358 
						 | 
						
							 347,185,177 
						 | 
						
							11,161,819
						 | 
						
							3.3
						 | 
						
							1,037
						 | 
						
							1,082
						 | 
						
							45
						 | 
						
							4.3
						 | 
					
					
						| 
							Teton
						 | 
						
							 20,197 
						 | 
						
							 21,069 
						 | 
						
							872
						 | 
						
							4.3
						 | 
						
							 188,613,277 
						 | 
						
							 196,131,991 
						 | 
						
							7,518,714
						 | 
						
							4.0
						 | 
						
							718
						 | 
						
							716
						 | 
						
							-2
						 | 
						
							-0.3
						 | 
					
					
						| 
							Uinta
						 | 
						
							 9,084 
						 | 
						
							 8,924 
						 | 
						
							-160
						 | 
						
							-1.8
						 | 
						
							 90,816,710 
						 | 
						
							 89,204,053 
						 | 
						
							-1,612,657
						 | 
						
							-1.8
						 | 
						
							769
						 | 
						
							769
						 | 
						
							0
						 | 
						
							0.0
						 | 
					
					
						| 
							Washakie
						 | 
						
							 3,974 
						 | 
						
							 3,884 
						 | 
						
							-90
						 | 
						
							-2.3
						 | 
						
							 37,409,608 
						 | 
						
							 36,694,731 
						 | 
						
							-714,877
						 | 
						
							-1.9
						 | 
						
							724
						 | 
						
							727
						 | 
						
							3
						 | 
						
							0.4
						 | 
					
					
						| 
							Weston 
						 | 
						
							 2,300 
						 | 
						
							 2,296 
						 | 
						
							-4
						 | 
						
							-0.2
						 | 
						
							 19,936,171 
						 | 
						
							 20,322,892 
						 | 
						
							386,721
						 | 
						
							1.9
						 | 
						
							667
						 | 
						
							681
						 | 
						
							14
						 | 
						
							2.1
						 | 
					
					
						| 
						Nonclassifiedb  | 
						
							 5,114 
						 | 
						
							 4,171 
						 | 
						
							-942
						 | 
						
							-18.4
						 | 
						
							 84,012,120 
						 | 
						
							 58,295,253 
						 | 
						
							-25,716,867
						 | 
						
							-30.6
						 | 
						
							1,264
						 | 
						
							1,075
						 | 
						
							-189
						 | 
						
							-14.9
						 | 
					
					
						|  
							
				       | 
					
					
						| 
						aPreliminary.  | 
					
					
						| bThe employer may be located statewide or in more than one county.  | 
					
					
						| 
							Source: Quarterly Census of Employment and Wages, developed through a cooperative program between Research & Planning and the U.S. Bureau of Labor Statistics.
						 | 
					
					
						| 
							Extract date: January 2014.
						 | 


			Table 5: Natrona County Average Monthly Employment, Total Payroll, and Average Weekly Wage for Third Quarter by Industry, 2012 and 2013a 


						| 
						NAICSb Title  | 
						
							Average Monthly Employment
						 | 
						
							Total Payroll
						 | 
						
							Average Weekly Wage
						 | 
					
					
						| 
							Third Quarter
						 | 
						
							Change
						 | 
						
							Third Quarter
						 | 
						
							Change
						 | 
						
							Third Quarter
						 | 
						
							Change
						 | 
					
					
						| 
							2012
						 | 
						
							2013
						 | 
						
							n
						 | 
						
							%
						 | 
						
							2012
						 | 
						
							2013
						 | 
						
							$
						 | 
						
							%
						 | 
						
							2012
						 | 
						
							2013
						 | 
						
							$
						 | 
						
							%
						 | 


						| 
							Total, All Industries
						 | 
						
							 41,256 
						 | 
						
							41,973 
						 | 
						
							717
						 | 
						
							1.7
						 | 
						
							$483,227,857
						 | 
						
							$495,036,929
						 | 
						
							$11,809,072
						 | 
						
							2.4
						 | 
						
							$901
						 | 
						
							$907
						 | 
						
							$6
						 | 
						
							0.7
						 | 
					
					
						| 
							Total Private
						 | 
						
							 35,861 
						 | 
						
							 36,568 
						 | 
						
							707
						 | 
						
							2.0
						 | 
						
							$417,753,097
						 | 
						
							$428,474,805
						 | 
						
							$10,721,708
						 | 
						
							2.6
						 | 
						
							$896
						 | 
						
							$901
						 | 
						
							$5
						 | 
						
							0.6
						 | 
					
					
						| 
							Agriculture
						 | 
						
							 127 
						 | 
						
							 123 
						 | 
						
							-4
						 | 
						
							-3.1
						 | 
						
							776,206
						 | 
						
							784,458
						 | 
						
							8,252
						 | 
						
							1.1
						 | 
						
							470
						 | 
						
							491
						 | 
						
							21
						 | 
						
							4.5
						 | 
					
					
						| 
							Mining
						 | 
						
							 4,043 
						 | 
						
							 4,102 
						 | 
						
							59
						 | 
						
							1.5
						 | 
						
							88,402,213
						 | 
						
							90,493,410
						 | 
						
							2,091,197
						 | 
						
							2.4
						 | 
						
							1,682
						 | 
						
							1,697
						 | 
						
							15
						 | 
						
							0.9
						 | 
					
					
						| 
							Utilities
						 | 
						
							 136 
						 | 
						
							 138 
						 | 
						
							2
						 | 
						
							1.5
						 | 
						
							2,384,126
						 | 
						
							2,576,287
						 | 
						
							192,161
						 | 
						
							8.1
						 | 
						
							1,348
						 | 
						
							1,436
						 | 
						
							88
						 | 
						
							6.5
						 | 
					
					
						| 
							Construction
						 | 
						
							 3,098 
						 | 
						
							 3,307 
						 | 
						
							209
						 | 
						
							6.7
						 | 
						
							40,132,630
						 | 
						
							43,918,266
						 | 
						
							3,785,636
						 | 
						
							9.4
						 | 
						
							996
						 | 
						
							1,022
						 | 
						
							26
						 | 
						
							2.6
						 | 
					
					
						| 
							Manufacturing
						 | 
						
							 1,877 
						 | 
						
							 1,717 
						 | 
						
							-160
						 | 
						
							-8.5
						 | 
						
							23,436,384
						 | 
						
							22,569,888
						 | 
						
							-866,496
						 | 
						
							-3.7
						 | 
						
							960
						 | 
						
							1,011
						 | 
						
							51
						 | 
						
							5.3
						 | 
					
					
						| 
							Wholesale Trade
						 | 
						
							 2,735 
						 | 
						
							 2,836 
						 | 
						
							101
						 | 
						
							3.7
						 | 
						
							40,022,729
						 | 
						
							41,438,810
						 | 
						
							1,416,081
						 | 
						
							3.5
						 | 
						
							1,126
						 | 
						
							1,124
						 | 
						
							-2
						 | 
						
							-0.2
						 | 
					
					
						| 
							Retail Trade
						 | 
						
							 4,795 
						 | 
						
							 4,870 
						 | 
						
							75
						 | 
						
							1.6
						 | 
						
							33,576,857
						 | 
						
							33,858,290
						 | 
						
							281,433
						 | 
						
							0.8
						 | 
						
							539
						 | 
						
							535
						 | 
						
							-4
						 | 
						
							-0.7
						 | 
					
					
						| 
							Transportation & Warehousing
						 | 
						
							 1,156 
						 | 
						
							 1,219 
						 | 
						
							63
						 | 
						
							5.4
						 | 
						
							15,960,544
						 | 
						
							16,990,441
						 | 
						
							1,029,897
						 | 
						
							6.5
						 | 
						
							1,062
						 | 
						
							1,072
						 | 
						
							10
						 | 
						
							0.9
						 | 
					
					
						| 
							Information
						 | 
						
							 469 
						 | 
						
							 456 
						 | 
						
							-13
						 | 
						
							-2.8
						 | 
						
							4,674,538
						 | 
						
							4,870,722
						 | 
						
							196,184
						 | 
						
							4.2
						 | 
						
							767
						 | 
						
							822
						 | 
						
							55
						 | 
						
							7.2
						 | 
					
					
						| 
							Finance & Insurance
						 | 
						
							 1,046 
						 | 
						
							 1,085 
						 | 
						
							39
						 | 
						
							3.7
						 | 
						
							13,636,393
						 | 
						
							14,295,242
						 | 
						
							658,849
						 | 
						
							4.8
						 | 
						
							1,003
						 | 
						
							1,013
						 | 
						
							10
						 | 
						
							1.0
						 | 
					
					
						| 
							Real Est. & Rental & Leasing
						 | 
						
							 939 
						 | 
						
							 1,017 
						 | 
						
							78
						 | 
						
							8.3
						 | 
						
							12,919,181
						 | 
						
							12,399,397
						 | 
						
							-519,784
						 | 
						
							-4.0
						 | 
						
							1,058
						 | 
						
							938
						 | 
						
							-120
						 | 
						
							-11.3
						 | 
					
					
						| 
							Professional & Technical Services
						 | 
						
							 1,482 
						 | 
						
							 1,493 
						 | 
						
							11
						 | 
						
							0.7
						 | 
						
							20,513,096
						 | 
						
							20,814,316
						 | 
						
							301,220
						 | 
						
							1.5
						 | 
						
							1,065
						 | 
						
							1,072
						 | 
						
							7
						 | 
						
							0.7
						 | 
					
					
						| 
							Mgmt. of Companies & Enterprises
						 | 
						
							 219 
						 | 
						
							 192 
						 | 
						
							-27
						 | 
						
							-12.3
						 | 
						
							3,861,527
						 | 
						
							3,709,859
						 | 
						
							-151,668
						 | 
						
							-3.9
						 | 
						
							1,356
						 | 
						
							1,486
						 | 
						
							130
						 | 
						
							9.6
						 | 
					
					
						| 
							Administrative & Waste Services
						 | 
						
							 1,442 
						 | 
						
							 1,476 
						 | 
						
							34
						 | 
						
							2.4
						 | 
						
							11,589,095
						 | 
						
							11,921,199
						 | 
						
							332,104
						 | 
						
							2.9
						 | 
						
							618
						 | 
						
							621
						 | 
						
							3
						 | 
						
							0.5
						 | 
					
					
						| 
							Educational Services
						 | 
						
							 121 
						 | 
						
							 124 
						 | 
						
							3
						 | 
						
							2.5
						 | 
						
							885,224
						 | 
						
							805,403
						 | 
						
							-79,821
						 | 
						
							-9.0
						 | 
						
							563
						 | 
						
							500
						 | 
						
							-63
						 | 
						
							-11.2
						 | 
					
					
						| 
							Health Care & Social Assistance
						 | 
						
							 5,592 
						 | 
						
							 5,758 
						 | 
						
							166
						 | 
						
							3.0
						 | 
						
							64,403,667
						 | 
						
							67,524,876
						 | 
						
							3,121,209
						 | 
						
							4.8
						 | 
						
							886
						 | 
						
							902
						 | 
						
							16
						 | 
						
							1.8
						 | 
					
					
						| 
							Ambulatory Health Care Services
						 | 
						
							 2,014 
						 | 
						
							 2,120 
						 | 
						
							106
						 | 
						
							5.3
						 | 
						
							31,404,292
						 | 
						
							33,628,592
						 | 
						
							2,224,300
						 | 
						
							7.1
						 | 
						
							1,199
						 | 
						
							1,220
						 | 
						
							21
						 | 
						
							1.8
						 | 
					
					
						| 
							Hospitals
						 | 
						
							 1,619 
						 | 
						
							 1,609 
						 | 
						
							-10
						 | 
						
							-0.6
						 | 
						
							20,815,273
						 | 
						
							20,986,353
						 | 
						
							171,080
						 | 
						
							0.8
						 | 
						
							989
						 | 
						
							1,003
						 | 
						
							14
						 | 
						
							1.4
						 | 
					
					
						| 
							Nursing & Res. Care Facilities
						 | 
						
							 904 
						 | 
						
							 944 
						 | 
						
							40
						 | 
						
							4.4
						 | 
						
							6,798,014
						 | 
						
							7,293,141
						 | 
						
							495,127
						 | 
						
							7.3
						 | 
						
							578
						 | 
						
							594
						 | 
						
							16
						 | 
						
							2.8
						 | 
					
					
						| 
							Social Assistance
						 | 
						
							 1,055 
						 | 
						
							 1,085 
						 | 
						
							30
						 | 
						
							2.8
						 | 
						
							5,386,088
						 | 
						
							5,616,790
						 | 
						
							230,702
						 | 
						
							4.3
						 | 
						
							393
						 | 
						
							398
						 | 
						
							5
						 | 
						
							1.3
						 | 
					
					
						| 
							Arts, Ent., & Recreation
						 | 
						
							 511 
						 | 
						
							 495 
						 | 
						
							-16
						 | 
						
							-3.1
						 | 
						
							2,023,410
						 | 
						
							2,011,111
						 | 
						
							-12,299
						 | 
						
							-0.6
						 | 
						
							305
						 | 
						
							313
						 | 
						
							8
						 | 
						
							2.6
						 | 
					
					
						| 
							Accommodation & Food Services
						 | 
						
							 3,937 
						 | 
						
							 4,310 
						 | 
						
							373
						 | 
						
							9.5
						 | 
						
							16,076,426
						 | 
						
							17,827,062
						 | 
						
							1,750,636
						 | 
						
							10.9
						 | 
						
							314
						 | 
						
							318
						 | 
						
							4
						 | 
						
							1.3
						 | 
					
					
						| 
							Other Services
						 | 
						
							 2,135 
						 | 
						
							 1,850 
						 | 
						
							-285
						 | 
						
							-13.3
						 | 
						
							22,478,851
						 | 
						
							19,665,768
						 | 
						
							-2,813,083
						 | 
						
							-12.5
						 | 
						
							810
						 | 
						
							818
						 | 
						
							8
						 | 
						
							1.0
						 | 
					
					
						| 
							Total Government
						 | 
						
							 5,395 
						 | 
						
							 5,405 
						 | 
						
							10
						 | 
						
							0.2
						 | 
						
							$65,474,760
						 | 
						
							$66,562,124
						 | 
						
							$1,087,364
						 | 
						
							1.7
						 | 
						
							$934
						 | 
						
							$947
						 | 
						
							$13
						 | 
						
							1.4
						 | 
					
					
						| 
							Federal Government
						 | 
						
							690
						 | 
						
							660
						 | 
						
							-30
						 | 
						
							-4.3
						 | 
						
							11,522,009
						 | 
						
							11,119,868
						 | 
						
							-402,141
						 | 
						
							-3.5
						 | 
						
							1,285
						 | 
						
							1,296
						 | 
						
							11
						 | 
						
							0.9
						 | 
					
					
						| 
							State Government
						 | 
						
							732
						 | 
						
							730
						 | 
						
							-2
						 | 
						
							-0.3
						 | 
						
							9,754,008
						 | 
						
							9,839,237
						 | 
						
							85,229
						 | 
						
							0.9
						 | 
						
							1,025
						 | 
						
							1,037
						 | 
						
							12
						 | 
						
							1.2
						 | 
					
					
						| 
							Local Government
						 | 
						
							3,973
						 | 
						
							4,015
						 | 
						
							42
						 | 
						
							1.1
						 | 
						
							44,198,743
						 | 
						
							45,603,019
						 | 
						
							1,404,276
						 | 
						
							3.2
						 | 
						
							856
						 | 
						
							874
						 | 
						
							18
						 | 
						
							2.1
						 | 
					
					
						| 
							Local Government Education
						 | 
						
							 ND 
						 | 
						
							 ND 
						 | 
						
							 ND 
						 | 
						
							 ND 
						 | 
						
							 ND 
						 | 
						
							 ND 
						 | 
						
							 ND 
						 | 
						
							 ND 
						 | 
						
							 ND 
						 | 
						
							 ND 
						 | 
						
							 ND 
						 | 
						
							 ND 
						 | 
					
					
						|  
							
				       | 
					
					
						| 
						aPreliminary.  | 
					
					
						| bNorth American Industry Classification System.  | 
					
					
						| 
							ND-Not disclosable due to confidentiality of information.
						 | 
					
					
						| 
							Source: Quarterly Census of Employment and Wages, developed through a cooperative program between Research & Planning and the U.S. Bureau of Labor Statistics.
						 | 
					
					
						| 
							Extract date: January 2014.
						 | 


			Table 6: Laramie County Average Monthly Employment, Total Payroll, and Average Weekly Wage for Third Quarter by Industry, 2012 and 2013a 


						| 
							NAICSb Title
						 | 
						
							Average Monthly Employment
						 | 
						
							Total Payroll
						 | 
						
							Average Weekly Wage
						 | 
					
					
						| 
							Third Quarter
						 | 
						
							Change
						 | 
						
							Third Quarter
						 | 
						
							Change
						 | 
						
							Third Quarter
						 | 
						
							Change
						 | 
					
					
						| 
							2012
						 | 
						
							2013
						 | 
						
							n
						 | 
						
							%
						 | 
						
							2012
						 | 
						
							2013
						 | 
						
							$
						 | 
						
							%
						 | 
						
							2012
						 | 
						
							2013
						 | 
						
							$
						 | 
						
							%
						 | 


						| 
							Total, All Industries
						 | 
						
							44,057
						 | 
						
							45,640
						 | 
						
							1,583
						 | 
						
							3.6
						 | 
						
							$456,020,440
						 | 
						
							$482,429,487
						 | 
						
							$26,409,047
						 | 
						
							5.8
						 | 
						
							$796
						 | 
						
							$813
						 | 
						
							$17
						 | 
						
							2.1
						 | 
					
					
						| 
							Total Private
						 | 
						
							30,754
						 | 
						
							32,305
						 | 
						
							1,551
						 | 
						
							5.0
						 | 
						
							$279,598,921
						 | 
						
							$303,807,440
						 | 
						
							$24,208,519
						 | 
						
							8.7
						 | 
						
							$699
						 | 
						
							$723
						 | 
						
							$24
						 | 
						
							3.4
						 | 
					
					
						| 
							Agriculture
						 | 
						
							322
						 | 
						
							341
						 | 
						
							19
						 | 
						
							5.9
						 | 
						
							2,378,979
						 | 
						
							2,549,226
						 | 
						
							170,247
						 | 
						
							7.2
						 | 
						
							568
						 | 
						
							575
						 | 
						
							7
						 | 
						
							1.2
						 | 
					
					
						| 
							Mining
						 | 
						
							201
						 | 
						
							260
						 | 
						
							59
						 | 
						
							29.4
						 | 
						
							3,677,476
						 | 
						
							4,955,325
						 | 
						
							1,277,849
						 | 
						
							34.7
						 | 
						
							1,407
						 | 
						
							1,466
						 | 
						
							59
						 | 
						
							4.2
						 | 
					
					
						| 
							Utilities
						 | 
						
							136
						 | 
						
							148
						 | 
						
							12
						 | 
						
							8.8
						 | 
						
							2,748,741
						 | 
						
							3,014,377
						 | 
						
							265,636
						 | 
						
							9.7
						 | 
						
							1,555
						 | 
						
							1,567
						 | 
						
							12
						 | 
						
							0.8
						 | 
					
					
						| 
							Construction
						 | 
						
							3,059
						 | 
						
							3,749
						 | 
						
							690
						 | 
						
							22.6
						 | 
						
							32,712,828
						 | 
						
							46,564,035
						 | 
						
							13,851,207
						 | 
						
							42.3
						 | 
						
							823
						 | 
						
							955
						 | 
						
							132
						 | 
						
							16.0
						 | 
					
					
						| 
							Manufacturing
						 | 
						
							1,340
						 | 
						
							1,355
						 | 
						
							15
						 | 
						
							1.1
						 | 
						
							18,087,830
						 | 
						
							18,494,028
						 | 
						
							406,198
						 | 
						
							2.2
						 | 
						
							1,038
						 | 
						
							1,050
						 | 
						
							12
						 | 
						
							1.2
						 | 
					
					
						| 
							Wholesale Trade
						 | 
						
							930
						 | 
						
							980
						 | 
						
							50
						 | 
						
							5.4
						 | 
						
							11,722,570
						 | 
						
							12,295,338
						 | 
						
							572,768
						 | 
						
							4.9
						 | 
						
							970
						 | 
						
							965
						 | 
						
							-5
						 | 
						
							-0.5
						 | 
					
					
						| 
							Retail Trade
						 | 
						
							5,435
						 | 
						
							5,739
						 | 
						
							304
						 | 
						
							5.6
						 | 
						
							35,397,790
						 | 
						
							37,444,231
						 | 
						
							2,046,441
						 | 
						
							5.8
						 | 
						
							501
						 | 
						
							502
						 | 
						
							1
						 | 
						
							0.2
						 | 
					
					
						| 
							Transportation & Warehousing
						 | 
						
							2,431
						 | 
						
							2,517
						 | 
						
							86
						 | 
						
							3.5
						 | 
						
							25,046,498
						 | 
						
							27,383,003
						 | 
						
							2,336,505
						 | 
						
							9.3
						 | 
						
							793
						 | 
						
							837
						 | 
						
							44
						 | 
						
							5.5
						 | 
					
					
						| 
							Information
						 | 
						
							1,145
						 | 
						
							1,128
						 | 
						
							-17
						 | 
						
							-1.5
						 | 
						
							12,274,724
						 | 
						
							12,687,462
						 | 
						
							412,738
						 | 
						
							3.4
						 | 
						
							825
						 | 
						
							865
						 | 
						
							40
						 | 
						
							4.8
						 | 
					
					
						| 
							Finance & Insurance
						 | 
						
							1,627
						 | 
						
							1,682
						 | 
						
							55
						 | 
						
							3.4
						 | 
						
							19,857,493
						 | 
						
							20,769,740
						 | 
						
							912,247
						 | 
						
							4.6
						 | 
						
							939
						 | 
						
							950
						 | 
						
							11
						 | 
						
							1.2
						 | 
					
					
						| 
							Real Estate & Rental & Leasing
						 | 
						
							569
						 | 
						
							579
						 | 
						
							10
						 | 
						
							1.8
						 | 
						
							5,134,094
						 | 
						
							5,522,818
						 | 
						
							388,724
						 | 
						
							7.6
						 | 
						
							694
						 | 
						
							734
						 | 
						
							40
						 | 
						
							5.8
						 | 
					
					
						| 
							Professional & Technical Services
						 | 
						
							1,444
						 | 
						
							1,573
						 | 
						
							129
						 | 
						
							8.9
						 | 
						
							21,719,950
						 | 
						
							21,865,225
						 | 
						
							145,275
						 | 
						
							0.7
						 | 
						
							1,157
						 | 
						
							1,069
						 | 
						
							-88
						 | 
						
							-7.6
						 | 
					
					
						| 
							Mgmt. of Companies & Enterprises
						 | 
						
							78
						 | 
						
							91
						 | 
						
							13
						 | 
						
							16.7
						 | 
						
							1,239,030
						 | 
						
							1,442,572
						 | 
						
							203,542
						 | 
						
							16.4
						 | 
						
							1,222
						 | 
						
							1,219
						 | 
						
							-3
						 | 
						
							-0.2
						 | 
					
					
						| 
							Administrative & Waste Services
						 | 
						
							1,763
						 | 
						
							1,771
						 | 
						
							8
						 | 
						
							0.5
						 | 
						
							11,242,760
						 | 
						
							10,956,035
						 | 
						
							-286,725
						 | 
						
							-2.6
						 | 
						
							491
						 | 
						
							476
						 | 
						
							-15
						 | 
						
							-3.1
						 | 
					
					
						| 
							Educational Services
						 | 
						
							239
						 | 
						
							237
						 | 
						
							-2
						 | 
						
							-0.8
						 | 
						
							1,542,389
						 | 
						
							1,578,193
						 | 
						
							35,804
						 | 
						
							2.3
						 | 
						
							496
						 | 
						
							512
						 | 
						
							16
						 | 
						
							3.2
						 | 
					
					
						| 
							Health Care & Social Assistance
						 | 
						
							4,024
						 | 
						
							4,008
						 | 
						
							-16
						 | 
						
							-0.4
						 | 
						
							43,397,077
						 | 
						
							44,022,836
						 | 
						
							625,759
						 | 
						
							1.4
						 | 
						
							830
						 | 
						
							845
						 | 
						
							15
						 | 
						
							1.8
						 | 
					
					
						| 
							Ambulatory Health Care Services
						 | 
						
							1,940
						 | 
						
							2,024
						 | 
						
							84
						 | 
						
							4.3
						 | 
						
							30,411,882
						 | 
						
							31,367,714
						 | 
						
							955,832
						 | 
						
							3.1
						 | 
						
							1,206
						 | 
						
							1,192
						 | 
						
							-14
						 | 
						
							-1.2
						 | 
					
					
						| 
							Nursing & Res. Care Facilities
						 | 
						
							868
						 | 
						
							860
						 | 
						
							-8
						 | 
						
							-0.9
						 | 
						
							6,254,162
						 | 
						
							6,310,336
						 | 
						
							56,174
						 | 
						
							0.9
						 | 
						
							554
						 | 
						
							564
						 | 
						
							10
						 | 
						
							1.8
						 | 
					
					
						| 
							Hospitals & Social Assistance
						 | 
						
							1,216
						 | 
						
							1,125
						 | 
						
							-91
						 | 
						
							-7.5
						 | 
						
							6,731,033
						 | 
						
							6,344,786
						 | 
						
							-386,247
						 | 
						
							-5.7
						 | 
						
							426
						 | 
						
							434
						 | 
						
							8
						 | 
						
							1.9
						 | 
					
					
						| 
							Arts, Entertainment, & Recreation
						 | 
						
							328
						 | 
						
							340
						 | 
						
							12
						 | 
						
							3.7
						 | 
						
							1,025,856
						 | 
						
							1,229,121
						 | 
						
							203,265
						 | 
						
							19.8
						 | 
						
							241
						 | 
						
							278
						 | 
						
							37
						 | 
						
							15.4
						 | 
					
					
						| 
							  Accommodation & Food Services
						 | 
						
							4,275
						 | 
						
							4,398
						 | 
						
							123
						 | 
						
							2.9
						 | 
						
							17,289,814
						 | 
						
							17,996,093
						 | 
						
							706,279
						 | 
						
							4.1
						 | 
						
							311
						 | 
						
							315
						 | 
						
							4
						 | 
						
							1.3
						 | 
					
					
						| 
							  Other Services
						 | 
						
							1,407
						 | 
						
							1,408
						 | 
						
							1
						 | 
						
							0.1
						 | 
						
							13,103,022
						 | 
						
							13,037,782
						 | 
						
							-65,240
						 | 
						
							-0.5
						 | 
						
							716
						 | 
						
							712
						 | 
						
							-4
						 | 
						
							-0.6
						 | 
					
					
						| 
							Total Government
						 | 
						
							13,304
						 | 
						
							13,335
						 | 
						
							31
						 | 
						
							0.2
						 | 
						
							$176,421,519
						 | 
						
							$178,622,047
						 | 
						
							$2,200,528
						 | 
						
							1.2
						 | 
						
							$1,020
						 | 
						
							$1,030
						 | 
						
							$10
						 | 
						
							1.0
						 | 
					
					
						| 
							Federal Government
						 | 
						
							2,557
						 | 
						
							2,599
						 | 
						
							42
						 | 
						
							1.6
						 | 
						
							41,545,823
						 | 
						
							41,337,948
						 | 
						
							-207,875
						 | 
						
							-0.5
						 | 
						
							1,250
						 | 
						
							1,223
						 | 
						
							-27
						 | 
						
							-2.2
						 | 
					
					
						| 
							State Government
						 | 
						
							3,976
						 | 
						
							3,944
						 | 
						
							-32
						 | 
						
							-0.8
						 | 
						
							57,226,461
						 | 
						
							57,064,470
						 | 
						
							-161,991
						 | 
						
							-0.3
						 | 
						
							1,107
						 | 
						
							1,113
						 | 
						
							6
						 | 
						
							0.5
						 | 
					
					
						| 
							Local Government
						 | 
						
							6,770
						 | 
						
							6,792
						 | 
						
							22
						 | 
						
							0.3
						 | 
						
							77,649,235
						 | 
						
							80,219,629
						 | 
						
							2,570,394
						 | 
						
							3.3
						 | 
						
							882
						 | 
						
							909
						 | 
						
							27
						 | 
						
							3.1
						 | 
					
					
						| 
							Local Government Education
						 | 
						
							3,759
						 | 
						
							3,788
						 | 
						
							29
						 | 
						
							0.8
						 | 
						
							39,570,807
						 | 
						
							39,546,984
						 | 
						
							-23,823
						 | 
						
							-0.1
						 | 
						
							810
						 | 
						
							803
						 | 
						
							-7
						 | 
						
							-0.8
						 | 
					
					
						|  					      
							
					   | 
					
					
						| aPreliminary.  | 
					
					
						| bNorth American Industry Classification System.  | 
					
					
						| 
							Source: Quarterly Census of Employment and Wages, developed through a cooperative program between Research & Planning and the U.S. Bureau of Labor Statistics.
						 | 
					
					
						| 
							Extract date: January 2014.
						 | 


			Table 7: Wyoming Average Monthly Employment, Total Payroll, and Average Weekly Wage for Third Quarter by Industry, 2012 and 2013a 


						| 
					  NAICSb Title  | 
						
							Average Monthly Employment
						 | 
						
							Total Payroll
						 | 
						
							Average Weekly Wage
						 | 
					
					
						| 
							Third Quarter
						 | 
						
							Change
						 | 
						
							Third Quarter
						 | 
						
							Change
						 | 
						
							Third Quarter
						 | 
						
							Change
						 | 
					
					
						| 
							2012
						 | 
						
							2013
						 | 
						
							n
						 | 
						
							%
						 | 
						
							2012
						 | 
						
							2013
						 | 
						
							$
						 | 
						
							%
						 | 
						
							2012
						 | 
						
							2013
						 | 
						
							$
						 | 
						
							%
						 | 


						|  
							
					     | 
					
					
						| 
						aPreliminary.  | 
					
					
						| bNorth American Industry Classification System.  | 
					
					
						| 
							Source: Quarterly Census of Employment and Wages, developed through a cooperative program between Research & Planning and the U.S. Bureau of Labor Statistics.
						 | 
					
					
						| 
							Extract date: January 2014.
				       | 


						| 
							Total, All Industries
						 | 
						
							284,180
						 | 
						
							285,450
						 | 
						
							1,270
						 | 
						
							0.4
						 | 
						
							$3,060,122,560
						 | 
						
							$3,125,831,216
						 | 
						
							$65,708,656
						 | 
						
							2.1
						 | 
						
							$828
						 | 
						
							$842
						 | 
						
							$14
						 | 
						
							1.7
						 | 
					
					
						| 
							Total Private
						 | 
						
							221,363
						 | 
						
							222,850
						 | 
						
							1,487
						 | 
						
							0.7
						 | 
						
							$2,351,173,782
						 | 
						
							$2,400,572,705
						 | 
						
							$49,398,923
						 | 
						
							2.1
						 | 
						
							$817
						 | 
						
							$829
						 | 
						
							$12
						 | 
						
							1.5
						 | 
					
					
						| 
							Agriculture
						 | 
						
							2,757
						 | 
						
							2,775
						 | 
						
							18
						 | 
						
							0.7
						 | 
						
							19,475,250
						 | 
						
							20,291,682
						 | 
						
							816,432
						 | 
						
							4.2
						 | 
						
							543
						 | 
						
							562
						 | 
						
							19
						 | 
						
							3.5
						 | 
					
					
						| 
							Mining
						 | 
						
							27,506
						 | 
						
							26,777
						 | 
						
							-729
						 | 
						
							-2.7
						 | 
						
							548,024,809
						 | 
						
							551,712,015
						 | 
						
							3,687,206
						 | 
						
							0.7
						 | 
						
							1,533
						 | 
						
							1,585
						 | 
						
							52
						 | 
						
							3.4
						 | 
					
					
						| 
							Utilities
						 | 
						
							2,473
						 | 
						
							2,489
						 | 
						
							16
						 | 
						
							0.6
						 | 
						
							49,190,178
						 | 
						
							50,513,466
						 | 
						
							1,323,288
						 | 
						
							2.7
						 | 
						
							1,530
						 | 
						
							1,561
						 | 
						
							31
						 | 
						
							2.0
						 | 
					
					
						| 
							Construction
						 | 
						
							23,385
						 | 
						
							23,519
						 | 
						
							134
						 | 
						
							0.6
						 | 
						
							287,270,139
						 | 
						
							288,535,006
						 | 
						
							1,264,867
						 | 
						
							0.4
						 | 
						
							945
						 | 
						
							944
						 | 
						
							-1
						 | 
						
							-0.1
						 | 
					
					
						| 
							Manufacturing
						 | 
						
							9,440
						 | 
						
							9,575
						 | 
						
							135
						 | 
						
							1.4
						 | 
						
							127,360,173
						 | 
						
							134,778,131
						 | 
						
							7,417,958
						 | 
						
							5.8
						 | 
						
							1,038
						 | 
						
							1,083
						 | 
						
							45
						 | 
						
							4.3
						 | 
					
					
						| 
							Wholesale Trade
						 | 
						
							9,196
						 | 
						
							9,299
						 | 
						
							103
						 | 
						
							1.1
						 | 
						
							127,741,708
						 | 
						
							130,923,926
						 | 
						
							3,182,218
						 | 
						
							2.5
						 | 
						
							1,069
						 | 
						
							1,083
						 | 
						
							14
						 | 
						
							1.3
						 | 
					
					
						| 
							Retail Trade
						 | 
						
							30,265
						 | 
						
							30,762
						 | 
						
							497
						 | 
						
							1.6
						 | 
						
							199,169,941
						 | 
						
							205,037,241
						 | 
						
							5,867,300
						 | 
						
							2.9
						 | 
						
							506
						 | 
						
							513
						 | 
						
							7
						 | 
						
							1.4
						 | 
					
					
						| 
							Transportation & Warehousing
						 | 
						
							9,638
						 | 
						
							9,914
						 | 
						
							276
						 | 
						
							2.9
						 | 
						
							113,801,831
						 | 
						
							119,732,963
						 | 
						
							5,931,132
						 | 
						
							5.2
						 | 
						
							908
						 | 
						
							929
						 | 
						
							21
						 | 
						
							2.3
						 | 
					
					
						| 
							Information
						 | 
						
							3,939
						 | 
						
							3,817
						 | 
						
							-122
						 | 
						
							-3.1
						 | 
						
							39,719,709
						 | 
						
							39,566,971
						 | 
						
							-152,738
						 | 
						
							-0.4
						 | 
						
							776
						 | 
						
							797
						 | 
						
							21
						 | 
						
							2.7
						 | 
					
					
						| 
							Finance & Insurance
						 | 
						
							6,669
						 | 
						
							6,846
						 | 
						
							177
						 | 
						
							2.7
						 | 
						
							80,935,634
						 | 
						
							85,497,920
						 | 
						
							4,562,286
						 | 
						
							5.6
						 | 
						
							934
						 | 
						
							961
						 | 
						
							27
						 | 
						
							2.9
						 | 
					
					
						| 
							Real Estate & Rental & Leasing
						 | 
						
							4,229
						 | 
						
							4,511
						 | 
						
							282
						 | 
						
							6.7
						 | 
						
							45,745,174
						 | 
						
							48,889,148
						 | 
						
							3,143,974
						 | 
						
							6.9
						 | 
						
							832
						 | 
						
							834
						 | 
						
							2
						 | 
						
							0.2
						 | 
					
					
						| 
							Professional & Technical Services
						 | 
						
							9,202
						 | 
						
							9,221
						 | 
						
							19
						 | 
						
							0.2
						 | 
						
							127,206,411
						 | 
						
							128,307,420
						 | 
						
							1,101,009
						 | 
						
							0.9
						 | 
						
							1,063
						 | 
						
							1,070
						 | 
						
							7
						 | 
						
							0.7
						 | 
					
					
						| 
							Mgmt. of Companies & Enterprises
						 | 
						
							985
						 | 
						
							1,040
						 | 
						
							55
						 | 
						
							5.6
						 | 
						
							19,400,647
						 | 
						
							21,591,577
						 | 
						
							2,190,930
						 | 
						
							11.3
						 | 
						
							1,515
						 | 
						
							1,597
						 | 
						
							82
						 | 
						
							5.4
						 | 
					
					
						| 
							Administrative & Waste Services
						 | 
						
							8,543
						 | 
						
							8,619
						 | 
						
							76
						 | 
						
							0.9
						 | 
						
							64,871,320
						 | 
						
							66,266,766
						 | 
						
							1,395,446
						 | 
						
							2.2
						 | 
						
							584
						 | 
						
							591
						 | 
						
							7
						 | 
						
							1.2
						 | 
					
					
						| 
							Educational Services
						 | 
						
							1,666
						 | 
						
							1,691
						 | 
						
							25
						 | 
						
							1.5
						 | 
						
							12,979,035
						 | 
						
							12,959,198
						 | 
						
							-19,837
						 | 
						
							-0.2
						 | 
						
							599
						 | 
						
							590
						 | 
						
							-9
						 | 
						
							-1.5
						 | 
					
					
						| 
							Health Care & Social Assistance
						 | 
						
							23,689
						 | 
						
							23,930
						 | 
						
							241
						 | 
						
							1.0
						 | 
						
							232,340,096
						 | 
						
							236,684,463
						 | 
						
							4,344,367
						 | 
						
							1.9
						 | 
						
							754
						 | 
						
							761
						 | 
						
							7
						 | 
						
							0.9
						 | 
					
					
						| 
							Ambulatory Health Care Services
						 | 
						
							9,325
						 | 
						
							9,503
						 | 
						
							178
						 | 
						
							1.9
						 | 
						
							126,752,166
						 | 
						
							129,187,777
						 | 
						
							2,435,611
						 | 
						
							1.9
						 | 
						
							1,046
						 | 
						
							1,046
						 | 
						
							0
						 | 
						
							0.0
						 | 
					
					
						| 
							Hospitals
						 | 
						
							3,081
						 | 
						
							3,025
						 | 
						
							-56
						 | 
						
							-1.8
						 | 
						
							38,286,546
						 | 
						
							38,615,278
						 | 
						
							328,732
						 | 
						
							0.9
						 | 
						
							956
						 | 
						
							982
						 | 
						
							26
						 | 
						
							2.7
						 | 
					
					
						| 
							Nursing & Res. Care Facilities
						 | 
						
							4,575
						 | 
						
							4,561
						 | 
						
							-14
						 | 
						
							-0.3
						 | 
						
							32,202,591
						 | 
						
							33,013,897
						 | 
						
							811,306
						 | 
						
							2.5
						 | 
						
							541
						 | 
						
							557
						 | 
						
							16
						 | 
						
							3.0
						 | 
					
					
						| 
							Social Assistance
						 | 
						
							6,708
						 | 
						
							6,841
						 | 
						
							133
						 | 
						
							2.0
						 | 
						
							35,098,793
						 | 
						
							35,867,511
						 | 
						
							768,718
						 | 
						
							2.2
						 | 
						
							402
						 | 
						
							403
						 | 
						
							1
						 | 
						
							0.2
						 | 
					
					
						| 
							Arts, Entertainment, & Recreation
						 | 
						
							3,487
						 | 
						
							3,638
						 | 
						
							151
						 | 
						
							4.3
						 | 
						
							16,822,402
						 | 
						
							18,240,599
						 | 
						
							1,418,197
						 | 
						
							8.4
						 | 
						
							371
						 | 
						
							386
						 | 
						
							15
						 | 
						
							4.0
						 | 
					
					
						| 
							Accommodation & Food Services
						 | 
						
							35,437
						 | 
						
							36,058
						 | 
						
							621
						 | 
						
							1.8
						 | 
						
							161,355,198
						 | 
						
							166,792,657
						 | 
						
							5,437,459
						 | 
						
							3.4
						 | 
						
							350
						 | 
						
							356
						 | 
						
							6
						 | 
						
							1.7
						 | 
					
					
						| 
							Other Services
						 | 
						
							8,858
						 | 
						
							8,369
						 | 
						
							-489
						 | 
						
							-5.5
						 | 
						
							77,764,127
						 | 
						
							74,251,556
						 | 
						
							-3,512,571
						 | 
						
							-4.5
						 | 
						
							675
						 | 
						
							682
						 | 
						
							7
						 | 
						
							1.0
						 | 
					
					
						| 
							Total Government
						 | 
						
							62,817
						 | 
						
							62,600
						 | 
						
							-217
						 | 
						
							-0.3
						 | 
						
							$708,948,778
						 | 
						
							$725,258,511
						 | 
						
							$16,309,733
						 | 
						
							2.3
						 | 
						
							$868
						 | 
						
							$891
						 | 
						
							$23
						 | 
						
							2.6
						 | 
					
					
						| 
							Federal Government
						 | 
						
							8,124
						 | 
						
							7,979
						 | 
						
							-145
						 | 
						
							-1.8
						 | 
						
							120,392,249
						 | 
						
							119,355,143
						 | 
						
							-1,037,106
						 | 
						
							-0.9
						 | 
						
							1,140
						 | 
						
							1,151
						 | 
						
							11
						 | 
						
							1.0
						 | 
					
					
						| 
							State Government
						 | 
						
							13,552
						 | 
						
							13,432
						 | 
						
							-120
						 | 
						
							-0.9
						 | 
						
							175,282,859
						 | 
						
							174,287,731
						 | 
						
							-995,128
						 | 
						
							-0.6
						 | 
						
							995
						 | 
						
							998
						 | 
						
							3
						 | 
						
							0.3
						 | 
					
					
						| 
							State Government Education
						 | 
						
							3,809
						 | 
						
							3,782
						 | 
						
							-27
						 | 
						
							-0.7
						 | 
						
							47,500,810
						 | 
						
							47,397,251
						 | 
						
							-103,559
						 | 
						
							-0.2
						 | 
						
							959
						 | 
						
							964
						 | 
						
							5
						 | 
						
							0.5
						 | 
					
					
						| 
							Local Government
						 | 
						
							41,142
						 | 
						
							41,189
						 | 
						
							47
						 | 
						
							0.1
						 | 
						
							413,273,670
						 | 
						
							431,615,637
						 | 
						
							18,341,967
						 | 
						
							4.4
						 | 
						
							773
						 | 
						
							806
						 | 
						
							33
						 | 
						
							4.3
						 | 
					
					
						| 
							Local Government Education
						 | 
						
							17,818
						 | 
						
							17,813
						 | 
						
							-5
						 | 
						
							0.0
						 | 
						
							173,437,400
						 | 
						
							187,178,775
						 | 
						
							13,741,375
						 | 
						
							7.9
						 | 
						
							749
						 | 
						
							808
						 | 
						
							60
						 | 
						
							8.0
						 | 
					
					
						| 
							Hospitals
						 | 
						
							6,923
						 | 
						
							7,019
						 | 
						
							96
						 | 
						
							1.4
						 | 
						
							90,224,945
						 | 
						
							94,752,044
						 | 
						
							4,527,099
						 | 
						
							5.0
						 | 
						
							1,003
						 | 
						
							1,038
						 | 
						
							36
						 | 
						
							3.6
						 |