Economic Indicators
Total nonfarm employment fell by 3.0% from January 2015 to January 2016.
| Jan | Dec | Jan | Percent Change | ||||
|---|---|---|---|---|---|---|---|
| 2016 (p) | 2015 (r) | 2015 (b) | Month | Year | |||
|
(p) Preliminary. (r) Revised. (b) Benchmarked. 1Local Area Unemployment Statistics Program estimates. 2Metropolitan Statistical Area. Note: Production worker hours and earnings data have been dropped from the Economic Indicators page because of problems with accuracy due to a small sample size and high item nonresponse. The Bureau of Labor Statistics will continue to publish these data online at http://www.bls.gov/eag/eag.wy.htm. |
|||||||
|
Wyoming Total Nonfarm Employment |
277,400 | 283,900 | 285,900 | -2.3 | -3.0 | ||
|
Wyoming State Government |
15,400 | 15,900 | 15,300 | -3.1 | 0.7 | ||
|
Laramie County Nonfarm Employment |
46,300 | 47,100 | 46,200 | -1.7 | 0.2 | ||
|
Natrona County Nonfarm Employment |
40,200 | 41,000 | 43,200 | -2.0 | -6.9 | ||
|
Selected U.S. Employment Data |
|||||||
|
U.S. Multiple Jobholders |
7,314,000 | 7,855,000 | 7,289,000 | -6.9 | 0.3 | ||
|
As a percent of all workers |
4.9% | 5.2% | 5.0% | N/A | N/A | ||
|
U.S. Discouraged Workers |
623,000 | 663,000 | 682,000 | -6.0 | -8.7 | ||
|
U.S. Part Time for Economic Reasons |
6,406,000 | 6,179,000 | 7,269,000 | 3.7 | -11.9 | ||
|
Wyoming Unemployment Insurance |
|||||||
|
Weeks Compensated |
26,441 | 27,092 | 18,667 | -2.4 | 41.6 | ||
|
Benefits Paid |
$10,492,866 | $10,582,711 | $6,931,523 | -0.8 | 51.4 | ||
|
Average Weekly Benefit Payment |
$396.84 | $390.62 | $371.32 | 1.6 | 6.9 | ||
|
State Insured Covered Jobs 1 |
264,479 | 268,773 | 266,340 | -1.6 | -0.7 | ||
|
Insured Unemployment Rate |
3.6% | 3.0% | 2.4% | N/A | N/A | ||
|
Consumer Price Index (U) for All U.S. Urban Consumers |
|||||||
|
(1982 to 1984 = 100) |
|||||||
|
All Items |
236.9 | 236.5 | 233.7 | 0.2 | 1.4 | ||
|
Food & Beverages
|
248.2 | 247.5 | 246.1 | 0.3 | 0.9 | ||
|
Housing |
240.4 | 239.5 | 235.5 | 0.4 | 2.1 | ||
|
Apparel |
121.9 | 122.8 | 122.5 | -0.7 | -0.5 | ||
|
Transportation |
190.2 | 191.5 | 190.9 | -0.7 | -0.4 | ||
|
Medical Care |
454.2 | 451.1 | 441.0 | 0.7 | 3.0 | ||
|
Recreation (Dec. 1997=100) |
116.1 | 115.6 | 115.3 | 0.4 | 0.7 | ||
|
Education & Communication (Dec. 1997=100)
|
139.5 | 139.4 | 137.6 | 0.1 | 1.4 | ||
|
Other Goods & Services
|
419.1 | 418.3 | 412.5 | 0.2 | 1.6 | ||
|
Producer Prices (1982 to 1984 = 100) |
|||||||
|
All Commodities |
182.5 | 183.8 | 192.0 | -0.7 | -4.9 | ||
|
Wyo. Bldg. Permits (New Privately Owned Housing Units Authorized) |
|||||||
|
Total Units |
93 | 116 | 70 | -19.8 | 32.9 | ||
|
Valuation |
$19,531,000 | $24,268,000 | $16,357,000 | -19.5 | 19.4 | ||
|
Single Family Homes |
65 | 91 | 61 | -28.6 | 6.6 | ||
|
Valuation |
$17,973,000 | $22,206,000 | $15,464,000 | -19.1 | 16.2 | ||
|
Casper MSA2Building Permits |
8 | 12 | 23 | -33.3 | -65.2 | ||
|
Valuation |
$1,982,000 | $2,514,000 | $5,260,000 | -21.2 | -62.3 | ||
|
Cheyenne MSA Building Permits |
21 | 60 | 10 | -65.0 | 110.0 | ||
|
Valuation |
$3,827,000 | $8,874,000 | $1,491,000 | -56.9 | 156.7 | ||
|
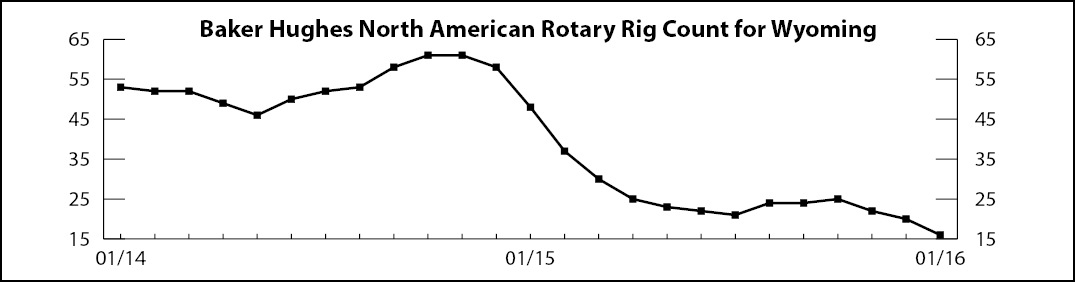
Baker Hughes North American Rotary Rig Count for Wyoming |
16 | 20 | 48 | -20.0 | -66.7 | ||