Wyoming Normalizeda Unemployment Insurance Statistics: Initial Claims
	by: Patrick Manning, Principal Economist
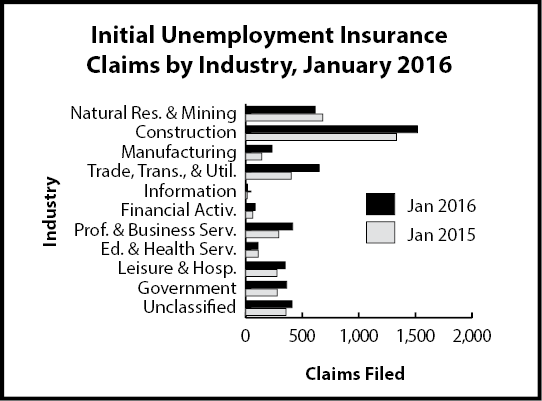
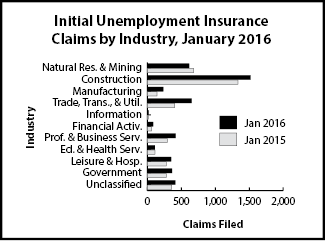
              Initial claims increased 21.1% (849 claims) from January 2015. There were large increases in retail trade (64.0%, or 110 claims), manufacturing (62.9 %, or 90 claims) and wholesale trade (122.6%, or 76 claims). 


							Initial  
					    Claims  | 
						
							Claims Filed
						 | 
						
							% Change  
					    Claims Filed  | 


							Jan  
					    16 | 
						Jan 
						  16 | 


							Jan  
					    16 | 
						
							Dec  
					    15 | 
						
							Jan  
					    15  | 
						Dec 
				      15  | 
						Jan 
						  15 | 


							Wyoming  
						  Statewide  | 
						
							
						 | 
						
							
						 | 
						
							
						 | 
						
							
						 | 
						
							
						 | 
					
					
						| 
							
						 | 
						
							
						 | 
						
							
						 | 
						
							
						 | 
						
							
						 | 
						
							
						 | 
					
                    
						TOTAL CLAIMS FILED   | 
                        
							4,874
						 | 
						
							4,082
						 | 
						
							4,025
						 | 
						
							19.4
						 | 
						
							21.1
						 | 
					
					
						| 
							
						 | 
						
							
						 | 
						
							
						 | 
						
							
						 | 
						
							
						 | 
						
							
						 | 
					
				  
						| 
					   TOTAL GOODS-PRODUCING   | 
						
							2,366
						 | 
					
							2,202
						 | 
						
							2,160
					 | 
						
							7.4
					 | 
						
							9.5
					 | 
					
					
						| 
							    Natural Res. & Mining
				          | 
						
							614
						 | 
						
							514
						 | 
						
							682
						 | 
						
							19.5
						 | 
						
							-10.0
						 | 
					
					
						| 
				         Mining   | 
						
							592
						 | 
						
							493
						 | 
						
							658
						 | 
						
							20.1
						 | 
						
							-10.0
						 | 
					
					
						| 
							          Oil & Gas Extraction
		                  | 
						
							31
						 | 
						
							37
						 | 
						
							51
						 | 
						
							-16.2
						 | 
						
							-39.2
						 | 
					
					
						| 
					     Construction   | 
						
							1,517
						 | 
						
							1,532
						 | 
						
							1,333
						 | 
						
							-1.0
						 | 
						
							13.8
						 | 
					
					
						| 
					     Manufacturing   | 
						
							233
						 | 
						
							154
						 | 
						
							143
						 | 
						
							51.3
						 | 
						
							62.9
						 | 
					
				  
						| 
					   TOTAL SERVICE-PROVIDING   | 
						
							1,735
						 | 
					
							1,196
						 | 
						
							1,228
					 | 
						
							45.1
					 | 
						
							41.3
					 | 
					
					
						| 
							    Trade, Transp., & Utilities
				          | 
						
							651
						 | 
						
							384
						 | 
						
							403
						 | 
						
							69.5
						 | 
						
							61.5
						 | 
					
					
						| 
				         Wholesale Trade   | 
						
							138
						 | 
						
							44
						 | 
						
							62
						 | 
						
							213.6
						 | 
						
							122.6
						 | 
					
					
						| 
				         Retail Trade   | 
						
							282
						 | 
						
							148
						 | 
						
							172
						 | 
						
							90.5
						 | 
						
							64.0
						 | 
					
					
						| 
							       Transp., Warehousing & Utilities 
			              | 
						
							231
						 | 
						
							192
						 | 
						
							169
						 | 
						
							20.3
						 | 
						
							36.7
						 | 
					
					
						| 
					     Information   | 
						
							17
						 | 
						
							12
						 | 
						
							14
						 | 
						
							41.7
						 | 
						
							21.4
						 | 
					
					
						| 
					     Financial Activities   | 
						
							84
						 | 
						
							60
						 | 
						
							62
						 | 
						
							40.0
						 | 
						
							35.5
						 | 
					
					
						| 
					     Prof. and Business Svcs.   | 
						
							415
						 | 
						
							293
						 | 
						
							293
						 | 
						
							41.6
						 | 
						
							41.6
						 | 
					
					
						| 
							    Educational & Health Svcs.
				          | 
						
							110
						 | 
						
							105
						 | 
						
							112
						 | 
						
							4.8
						 | 
						
							-1.8
						 | 
					
					
						| 
							    Leisure & Hospitality
				          | 
						
							349
						 | 
						
							277
						 | 
						
							277
						 | 
						
							26.0
						 | 
						
							26.0
						 | 
					
					
						| 
					     Other Svcs., exc. Public Admin.   | 
						
							102
						 | 
						
							58
						 | 
						
							61
						 | 
						
							75.9
						 | 
						
							67.2
						 | 
					
					
						| 
						 TOTAL GOVERNMENT   | 
						
							362
						 | 
						
							260
						 | 
						
							279
						 | 
						
							39.2
						 | 
						
							29.7
						 | 
					
					
						| 
					     Federal Government   | 
						
							125
						 | 
						
							138
						 | 
						
							126
						 | 
						
							-9.4
						 | 
						
							-0.8
						 | 
					
					
						| 
					     State Government   | 
						
							32
						 | 
						
							20
						 | 
						
							33
						 | 
						
							60.0
						 | 
						
							-3.0
						 | 
					
					
						| 
					     Local Government   | 
						
							204
						 | 
						
							101
						 | 
						
							119
						 | 
						
							102.0
						 | 
						
							71.4
						 | 
					
					
						| 
				         Local Education   | 
						
							21
						 | 
						
							18
						 | 
						
							16
						 | 
						
							16.7
						 | 
						
							31.3
						 | 
					
					
						| 
						 UNCLASSIFIED   | 
						
							410
						 | 
						
							422
						 | 
						
							357
						 | 
						
							-2.8
						 | 
						
							14.8
						 | 


						| 
						 Laramie County   | 
						
							
						 | 
						
							
						 | 
						
							
						 | 
						
							
						 | 
						
							
						 | 


						| 
						 TOTAL CLAIMS FILED   | 
						
							497
						 | 
						
							603
						 | 
						
							471
						 | 
						
							-17.6
						 | 
						
							5.5
						 | 


						| 
					   TOTAL GOODS-PRODUCING   | 
						
							261
						 | 
						
							405
						 | 
						
							230
						 | 
						
							-35.6
						 | 
						
							13.5
						 | 
				  
					
						| 
				       Construction   | 
						
							210
						 | 
						
							316
						 | 
						
							185
						 | 
						
							-33.5
						 | 
						
							13.5
						 | 
				  
					
						| 
						 TOTAL SERVICE-PROVIDING   | 
						
							197
						 | 
						
							150
						 | 
						
							189
						 | 
						
							31.3
						 | 
						
							4.2
						 | 
					
					
						| 
							    Trade, Transp., & Utilities
			            | 
						
							76
						 | 
						
							72
						 | 
						
							63
						 | 
						
							5.6
						 | 
						
							20.6
						 | 
				  
					
						| 
					     Financial Activities   | 
						
							14
						 | 
						
							5
						 | 
						
							11
						 | 
						
							180.0
						 | 
						
							27.3
						 | 
					
					
						| 
							    Prof. & Business Svcs.
				          | 
						
							44
						 | 
						
							35
						 | 
						
							48
						 | 
						
							25.7
						 | 
						
							-8.3
						 | 
					
					
						| 
							    Educational & Health Svcs.
				          | 
						
							23
						 | 
						
							10
						 | 
						
							32
						 | 
						
							130.0
						 | 
						
							-28.1
						 | 
					
				  
						| 
							    Leisure & Hospitality
				          | 
						
							22
						 | 
						
							16
						 | 
						
							25
						 | 
						
							37.5
						 | 
						
							-12.0
						 | 
					
					
						| 
						 TOTAL GOVERNMENT   | 
						
							20
						 | 
						
							20
						 | 
						
							29
						 | 
						
							0.0
						 | 
						
							-31.0
						 | 
					
					
						| 
					   UNCLASSIFIED   | 
						
							18
						 | 
						
							26
						 | 
						
							22
						 | 
						
							-30.8
						 | 
						
							-18.2
						 | 


						| 
					   Natrona County   | 
						
							
						 | 
						
							
						 | 
						
							
						 | 
						
							
						 | 
						
							
						 | 


						| 
					   TOTAL CLAIMS FILED   | 
						
							799
						 | 
						
							641
						 | 
						
							468
						 | 
						
							24.6
						 | 
						
							70.7
						 | 


						| 
					   TOTAL GOODS-PRODUCING   | 
						
							434
						 | 
						
							372
						 | 
						
							274
						 | 
						
							16.7
						 | 
						
							58.4
						 | 
				  
					
						| 
				       Construction   | 
						
							279
						 | 
						
							265
						 | 
						
							162
						 | 
						
							5.3
						 | 
						
							72.2
						 | 
				  
					
						| 
						 TOTAL SERVICE-PROVIDING   | 
						
							330
						 | 
						
							245
						 | 
						
							165
						 | 
						
							34.7
						 | 
						
							100.0
						 | 
					
					
						| 
							    Trade, Transp., & Utilities
			            | 
						
							144
						 | 
						
							89
						 | 
						
							70
						 | 
						
							61.8
						 | 
						
							105.7
						 | 
				  
					
						| 
					     Financial Activities   | 
						
							12
						 | 
						
							19
						 | 
						
							8
						 | 
						
							-36.8
						 | 
						
							50.0
						 | 
					
					
						| 
							    Prof. & Business Svcs.
				          | 
						
							70
						 | 
						
							46
						 | 
						
							34
						 | 
						
							52.2
						 | 
						
							105.9
						 | 
					
					
						| 
							    Educational & Health Svcs.
				          | 
						
							17
						 | 
						
							22
						 | 
						
							19
						 | 
						
							-22.7
						 | 
						
							-10.5
						 | 
					
				  
						| 
							    Leisure & Hospitality 
				          | 
						
							52
						 | 
						
							49
						 | 
						
							18
						 | 
						
							6.1
						 | 
						
							188.9
						 | 
					
					
						| 
						 TOTAL GOVERNMENT   | 
						
							14
						 | 
						
							12
						 | 
						
							11
						 | 
						
							16.7
						 | 
						
							27.3
						 | 
					
				  
						| 
				     UNCLASSIFIED   | 
						
							21
					 | 
						
							11
					 | 
						
							16
					 | 
						
							90.9
					 | 
						
							31.3
					 | 


						  | aAn average month is considered 4.33 weeks. If a month has four weeks, the normalization factor is 1.0825. If the month has five weeks, the normalization factor is 0.866. The number of raw claims is multiplied by the normalization factor to achieve the normalized claims counts. | 
	    
						
						  | 
                              
                            Initial Claims by Industry


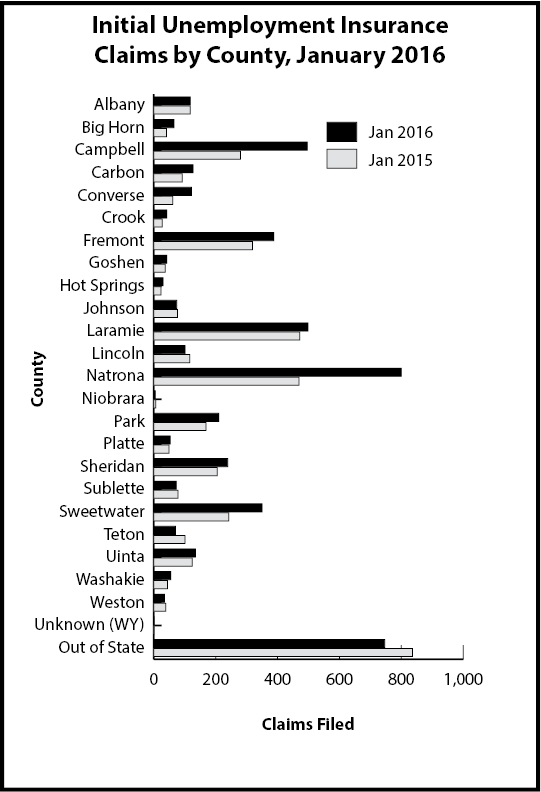
                            Initial Claims by County
  
                               
                           |