Demographics and Earnings of Persons Working in Wyoming
by County, Industry, Age, & Sex, 2000-2024
Table of Contents | Introduction | Definitions | Home
Tables by Industry, County, Age, & Sex, 2000-2024 (Excel)
Prepared June 2, 2025.
Small Increase in Persons Working in Wyoming in 2024
Excerpted from the 2025 Wyoming Workforce Annual Report
by: Michael Moore, Research Supervisor
Each year, the Research & Planning (R&P) section of the Wyoming Department of Workforce Services publishes detailed demographics tables. These tables contain information such as total number of workers, average annual wage, average number of quarters worked, and average number of employers worked for by sex and age group, and presented by county and industry. These tables are available at https://doe.state.wy.us/LMI/demographics.htm.
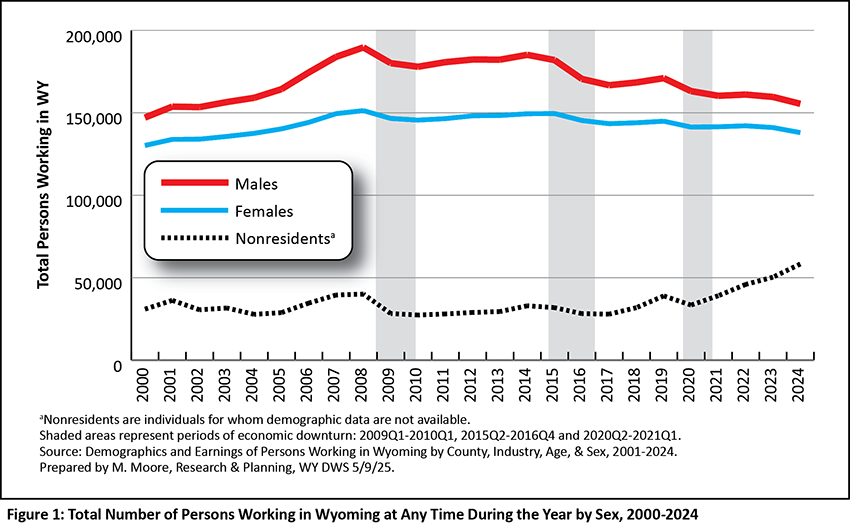
The total number of persons working in Wyoming at any time during the year increased from 351,026 in 2023 to 351,812 in 2024 (786, or 0.2%; see Table 1). This marked the smallest over-the-year job growth since 2021, when Wyoming was recovering from its most recent economic downturn brought on by the Covid-19 pandemic (see Figure 1).
The number of individuals working in Wyoming is based on employers’ quarterly wage and employment reports to the Unemployment Insurance (UI) tax section of the Wyoming Department of Workforce Services; these are referred to as wage records. UI covered employment represents more than 90% of Wyoming’s total wage and salary employment. Any individual who had wages in Wyoming at any time from 2000 to 2024 is included in the summary counts presented in this research. Each individual is counted only once.
As shown in Table 1, the number of persons working in Wyoming decreased for most age groups among residents from 2023 to 2024, with the greatest losses seen among workers ages 25-34 (-2,692, or -4.4%), 35-44 (-1,518, or -2.4%), and under 20 (-1,408, or -5.7%). The number of workers 65 and older increased by 492, or 2.2%.
Over the year, Wyoming experienced a decrease in resident female (-3,051, or -2.2%) and male (-4,146, or -2.6%) workers (see Table 1). At the same time, the number of nonresident workers increased from 50,307 to 58,290 — an increase of 7,983 individuals, or 15.9%. The term nonresidents refers to individuals for whom demographic data are not available; these are typically individuals who commute to Wyoming from another state or country for work. Nonresidents also may be individuals who moved to Wyoming for work in 2024 but had not established residency by the end of the year. Nonresident workers also may be individuals who work remotely for a Wyoming employer.
Employers typically turn to nonresident workers once they have exhausted the available resident labor force. Wyoming has seen a steady decrease in resident workers over the last decade. The number of resident males working in Wyoming decreased fairly substantially during each of the last two economic downturns (see Figure 1). The number of resident female workers also decreased, but not as drastically. In contrast, the number of nonresident workers has increased quite a bit since 2020.
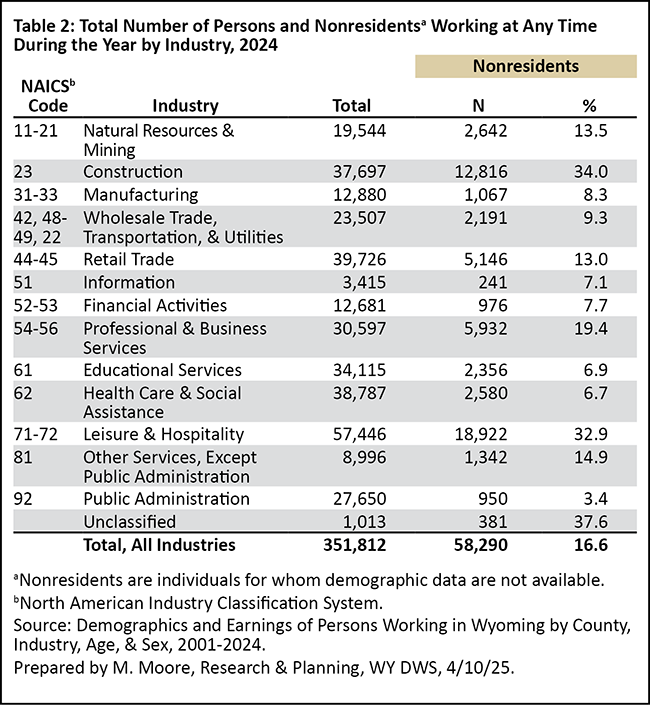
Nonresident workers frequently are individuals who come to Wyoming for seasonal or temporary work. As shown in Table 2, about one-third of all persons working in construction (34.0%) and leisure & hospitality (32.9%) in 2024 were nonresidents. Once seasonal work or a short-term construction project is completed, nonresident workers typically return to their home states. Other industries with longer lasting jobs often have a lower percentage of nonresident workers, such as public administration (3.4%), educational services (6.9%), health care & social assistance (6.7%), and information (7.1%).
Some nonresident workers may move to Wyoming for long-term employment. Counts are revised each year as demographic data become available. For example, a male may have been a nonresident worker in Wyoming in 2014, but then obtained a Wyoming driver's license in 2015. When R&P updates its demographics data each year, data are backfilled and that person will be counted as a resident male worker.
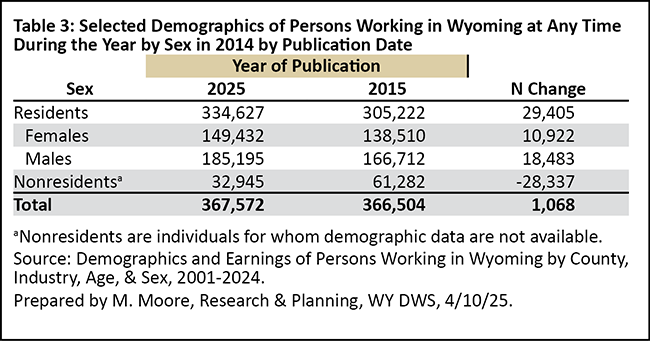
As R&P is able to identify more individuals and the data are revised over time, the originally published number of nonresidents decreases and the number of resident workers increases (see Table 6.3). For example, R&P originally reported 61,282 nonresidents working in Wyoming in 2014 (see Table 3). By 2025, R&P was able to identify demographic data for 28,337 of those individuals, reducing the count of nonresident workers in 2014 to 32,945.
This indicates that nearly half (46.2%) of the nonresident workers from 2014 either stayed in Wyoming long enough to establish residency or collect Unemployment Insurance (UI) benefits, while the remaining half did not. As more data became available, the number of females and males working in Wyoming in 2014 increased by 10,922 and 18,483, respectively.
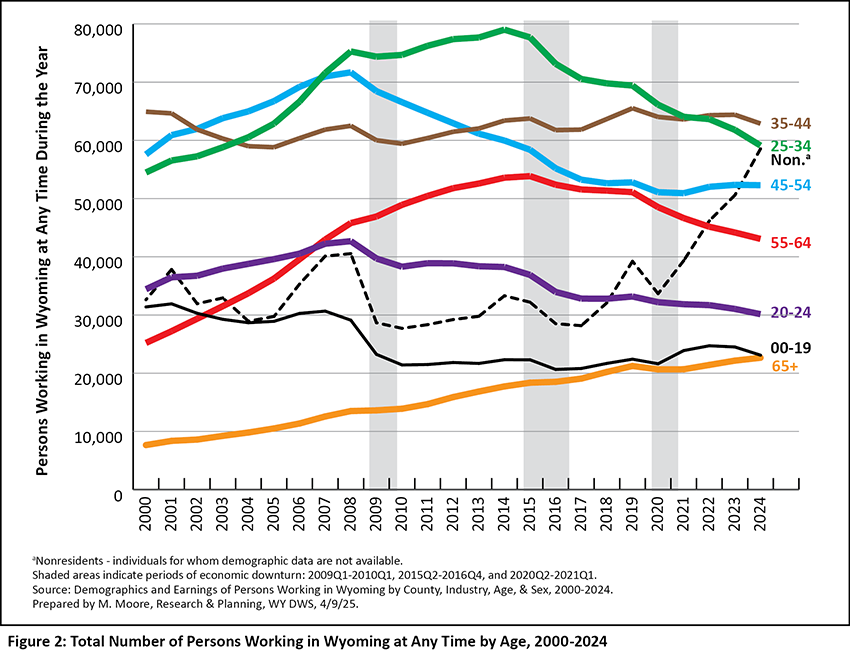
Figure 2 illustrates trends in persons working in Wyoming from 2000 to 2024 by age. Over the last 10 years, the number of individuals ages 25-34 decreased substantially, while the number of individuals ages 65 and older continued to increase.
The demographics of Wyoming's population contribute to some of these trends. The generations discussed in this article were identified by the Pew Research Center (2021).
For example, a large number of baby boomers (those born between 1946 and 1964) aged out of the 55-64 age group in recent years, with fewer generation X (those born from 1965 to 1980) to replace them; this also explains the increase of workers 65 and older, as more and more baby boomers move into that age group. Despite a "retirement boom" observed nationally (Montes, Smith, and Dajon, 2022), the number of individuals 65 and older working in Wyoming continued to increase.
The number of Wyoming workers ages 25-34 decreased substantially after 2014. Research & Planning identified several possible reasons for the decline (Moore, 2021), such as the large number of millennials (those born from 1981 to 1996) moving away, working in another state, or working gig-type jobs. These types of jobs may not be covered by Wyoming UI, and therefore not found in wage records. In addition, more millennials aged out of the 25-34 range, with fewer generation Z (those born from 1997 to 2012) workers in that age group. The 20-24 age group also consistently declined as fewer gen Z individuals joined the workforce.
The substantial increase in nonresidents working in Wyoming may be an indication that Wyoming employers had to search outside of the state for workers because of younger workers leaving the state, or not participating in the traditional labor force. Whether those workers stay in the state and establish residency remains to be seen.
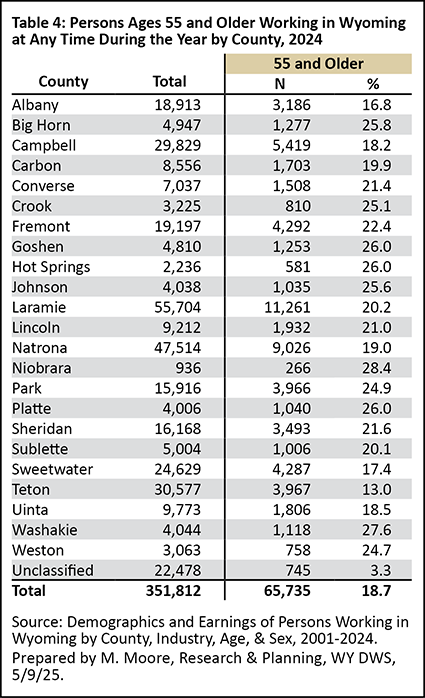
Of the 351,812 individuals working in Wyoming at any time during the year in 2024, nearly one in five (18.7%) were age 55 or older (see Table 4). In Wyoming's least populous counties, individuals 55 and older made up an even greater proportion of persons working. In Niobrara County, for example, 28.4% of the 936 persons working were age 55 or older.
References
Montes, J., Smith, C., and Dajon, J. (2022). The great retirement boom: The pandemic-era surge in retirements and implications for future labor force participation. Federal Reserve Board, Washington, D.C. Retrieved May 9, 2025, from https://tinyurl.com/3ze66xpt
Moore, M. (2021, September). Millennials continue to leave Wyoming and its labor market. Wyoming Labor Force Trends, 58(9). Research & Planning, WY DWS. Retrieved May 9, 2025, from https://doe.state.wy.us/LMI/trends/0921/0921.pdf
Pew Research Center. (2021, May 24). The generations defined, 2021. Archived.
 Hire Wyo
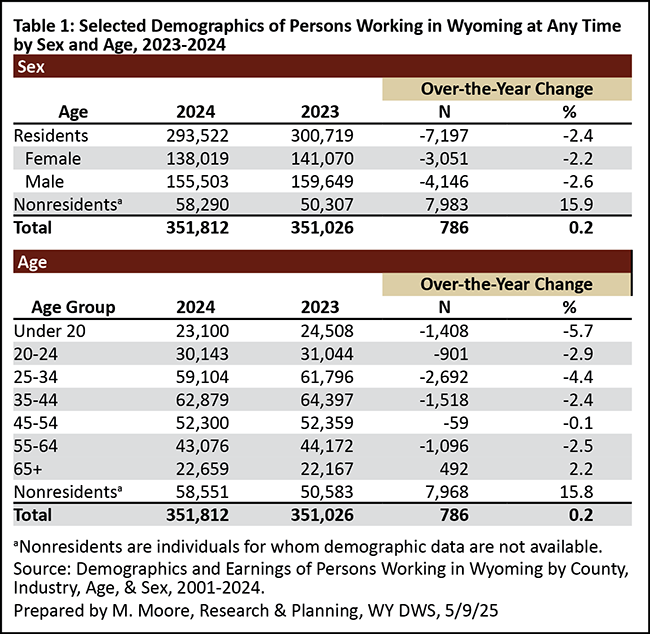