Economic Indicators
The number of building permits issued for single-family homes in Wyoming fell 5.3% from September 2012 to September 2013.
| Sep | Aug | Sep | Percent Change | ||||
|---|---|---|---|---|---|---|---|
| 2013 (p) | 2013 (r) | 2012 (b) | Month | Year | |||
| Wyoming Total Nonfarm Employment | 296,400 | 300,200 | 295,800 | -1.3 | 0.2 | ||
| Wyoming State Government | 15,900 | 14,900 | 16,300 | 6.7 | -2.5 | ||
| Laramie County Nonfarm Employment | 46,400 | 46,700 | 45,100 | -0.6 | 2.9 | ||
| Natrona County Nonfarm Employment | 41,800 | 41,600 | 41,700 | 0.5 | 0.2 | ||
| Selected U.S. Employment Data | |||||||
| U.S. Multiple Jobholders | 6,952,000 | 6,776,000 | 6,818,000 | 2.6 | 2.0 | ||
| As a percent of all workers | 4.8% | 4.7% | 4.8% | N/A | N/A | ||
| U.S. Discouraged Workers | 852,000 | 866,000 | 802,000 | -1.6 | 6.2 | ||
| U.S. Part Time for Economic Reasons | 7,522,000 | 7,690,000 | 8,110,000 | -2.2 | -7.3 | ||
| Wyoming Unemployment Insurance | |||||||
| Weeks Compensated | 11,267 | 12,791 | 13,097 | -11.9 | -14.0 | ||
| Benefits Paid | $4,160,714 | $4,623,227 | $4,613,165 | -10.0 | -9.8 | ||
| Average Weekly Benefit Payment | $369.28 | $361.44 | $352.23 | 2.2 | 4.8 | ||
| State Insured Covered Jobs1 | 275,406 | 274,280 | 271,141 | 0.4 | 1.6 | ||
| Insured Unemployment Rate | 1.6% | 1.8% | 1.9% | N/A | N/A | ||
| Consumer Price Index (U) for All U.S. Urban Consumers | |||||||
| (1982 to 1984 = 100) | |||||||
| All Items | 234.1 | 233.9 | 231.4 | 0.1 | 1.2 | ||
| Food & Beverages | 237.4 | 237.3 | 234.2 | 0.0 | 1.4 | ||
| Housing | 228.8 | 228.6 | 223.9 | 0.1 | 2.2 | ||
| Apparel | 129.7 | 125.8 | 128.6 | 3.1 | 0.8 | ||
| Transportation | 218.1 | 219.2 | 221.7 | -0.5 | -1.6 | ||
| Medical Care | 428.0 | 426.9 | 418.0 | 0.3 | 2.4 | ||
| Recreation (Dec. 1997=100) | 115.2 | 115.3 | 115.0 | -0.1 | 0.2 | ||
| Education & Communication (Dec. 1997=100) | 136.7 | 136.1 | 134.6 | 0.4 | 1.5 | ||
| Other Goods & Services | 402.7 | 402.4 | 396.2 | 0.1 | 1.6 | ||
| Producer Prices (1982 to 1984 = 100) | |||||||
| All Commodities | 204.0 | 204.3 | 204.4 | -0.1 | -0.2 | ||
| Wyo. Bldg. Permits (New Privately Owned Housing Units Authorized) | |||||||
| Total Units | 162 | 167 | 190 | -3.0 | -14.7 | ||
| Valuation | $36,606,000 | $41,402,000 | $41,076,000 | -11.6 | -10.9 | ||
| Single Family Homes | 124 | 136 | 131 | -8.8 | -5.3 | ||
| Valuation | $35,584,000 | $39,414,000 | $36,871,000 | -9.7 | -3.5 | ||
| Casper MSA2 Building Permits | 33 | 50 | 25 | -34.0 | 32.0 | ||
| Valuation | $7,733,000 | $7,375,000 | $4,521,000 | 4.9 | 71.0 | ||
| Cheyenne MSA Building Permits | 61 | 37 | 21 | 64.9 | 190.5 | ||
| Valuation | $7,071,000 | $6,031,000 | $1,984,000 | 17.2 | 256.4 | ||
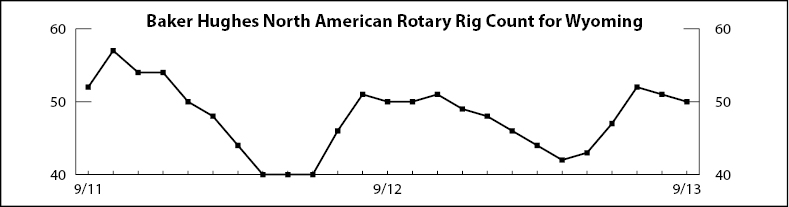
| Baker Hughes North American Rotary Rig Count for Wyoming | 50 | 51 | 50 | -2.0 | 0.0 | ||
Baker Hughes North American Rotary Rig Count for Wyoming
|
|||||||
| (p) Preliminary. (r) Revised. (b) Benchmarked. | |||||||
| 1Local Area Unemployment Statistics Program estimates. | |||||||
| 2Metropolitan Statistical Area. | |||||||
| Note: Production worker hours and earnings data have been dropped from the Economic Indicators page because of problems with accuracy due to a small sample size and high item nonresponse. The Bureau of Labor Statistics will continue to publish these data online at http://www.bls.gov/eag/eag.wy.htm. | |||||||