Labor Market Information > Wyoming Labor Force Trends > September 2011 > Article 3 Tables and Figures
Long-Term Unemployment in Wyoming and the U.S. (Tables and Figures)
| Unemployed2 | Job Loser | Completed Temp Job |
Job Leavers | Reentrants | New Entrants | Duration of Unemployment in Weeks |
|||
|---|---|---|---|---|---|---|---|---|---|
| Year | % | N | % | % | % | % | % | Mean | Median |
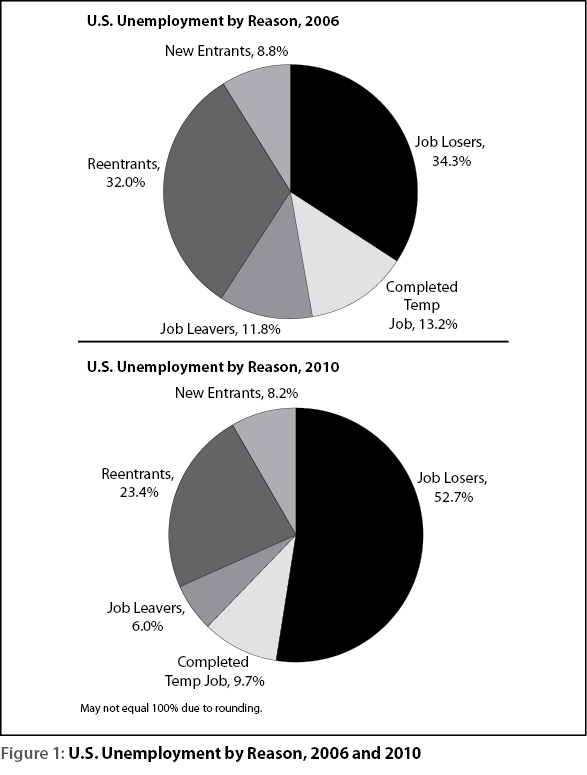
| 2006 | 4.6 | 7,001,000 | 34.3 | 13.2 | 11.8 | 32.0 | 8.8 | 16.8 | 8.3 |
| 2007 | 4.6 | 7,078,000 | 35.9 | 13.8 | 11.2 | 30.3 | 8.9 | 16.8 | 8.5 |
| 2008 | 5.8 | 8,924,000 | 40.5 | 13.2 | 10.0 | 27.7 | 8.6 | 17.9 | 9.4 |
| 2009 | 9.3 | 14,265,000 | 52.8 | 11.4 | 6.2 | 22.3 | 7.3 | 24.4 | 15.1 |
| 2010 | 9.6 | 14,825,000 | 52.7 | 9.7 | 6.0 | 23.4 | 8.2 | 33.0 | 21.4 |
| Change from 2006 to 2010 | |||||||||
| 7,824,000 | 18.4 | -3.5 | -5.8 | -8.6 | -0.6 | 16.2 | 13.1 | ||
| 1Based on annual averages | |||||||||
| 2Unemployment rate is the published BLS estimate | |||||||||
| Year | Unemployed2 | Job Loser | Completed Temp Job |
Job Leavers | Reentrants | New Entrants3 |
Duration of Unemployment in Weeks |
||||||||
|---|---|---|---|---|---|---|---|---|---|---|---|---|---|---|---|
| % | N | % | % | % | % | % | Mean | Median | |||||||
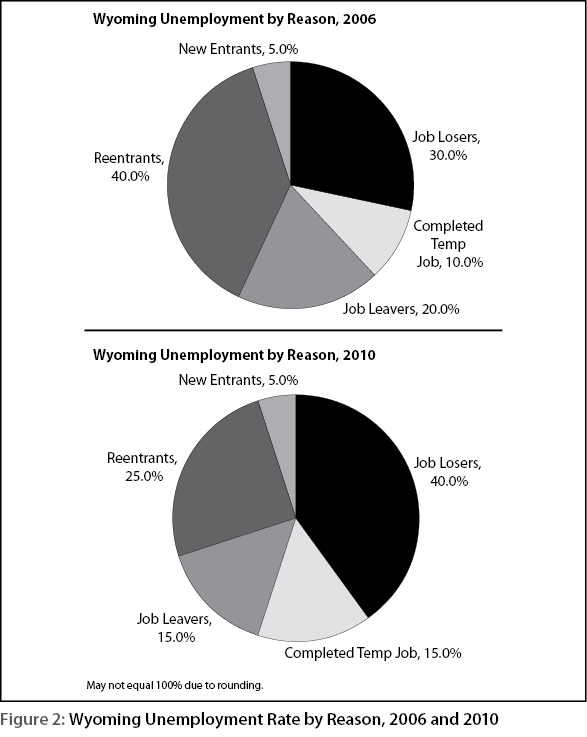
| 2006 | 3.2 | 10,000 | 30.0 | 10.0 | 20.0 | 40.0 | 5.0 | 10.1 | 3.9 | ||||||
| 2007 | 2.8 | 8,000 | 12.5 | 25.0 | 25.0 | 37.5 | 6.3 | 8.7 | 4.2 | ||||||
| 2008 | 3.1 | 9,000 | 22.2 | 22.2 | 22.2 | 33.3 | 5.6 | 9.0 | 3.8 | ||||||
| 2009 | 6.5 | 19,000 | 52.6 | 15.8 | 10.5 | 21.1 | 5.3 | 15.6 | 9.2 | ||||||
| 2010 | 7.0 | 20,000 | 40.0 | 15.0 | 15.0 | 25.0 | 5.0 | 22.7 | 12.6 | ||||||
| Change from 2006 to 2010 | |||||||||||||||
| 10,000 | 10.0 | 5.0 | -5.0 | -15.0 | 0.0 | 12.6 | 8.7 | ||||||||
| 1Based on annual averages. | |||||||||||||||
| 2Unemployment rate is the published BLS estimate. | |||||||||||||||
| 3If new entrants were less than 500, the percentage is based on a numerator of 500. | |||||||||||||||
| Note: The total percentage across categories may not equal 100% given the new entrants calculation. | |||||||||||||||
| State | 2010 Unemployment Rate |
|---|---|
| Nevada | 14.90% |
| California | 12.40% |
| Michigan | 12.50% |
| Florida | 11.50% |
| Wyoming | 7.00% |
| Source: U. S. Bureau of Labor Statistics (http://www.bls.gov/news.release/pdf/srgune.pdf). |
|