Wyoming Labor Force Trends
August 2025 | Volume 62, No. 8
Click Here for PDF
Return to Table of Contents
Comparing Wyoming’s Manufacturing Sector to the U.S.
by: David Bullard, Senior Economist
While employment in the U.S. manufacturing sector has fallen, rising labor productivity has caused total output to increase. In Wyoming, both employment and output have increased from where they stood in early 1990.
Although Wyoming’s manufacturing sector is not large (accounting for only 3.5% of total nonfarm jobs in 2024), it does pay wages that are much higher than average. The 2024 annual average wage for manufacturing jobs in Wyoming was $79,059, which is considerably more than the statewide average wage of $61,586.
This article compares employment in Wyoming’s manufacturing sector to the U.S. and reviews trends over the past few decades.
Figure 1 shows Wyoming total nonfarm employment and manufacturing employment from January 1990 to April 2025. Total employment steadily increased from early 1990 until October 2008. During that period, Wyoming added more than 100,000 jobs. Then, during the Great Recession, 19,300 jobs were lost, bringing employment to a low point of 281,500 in December 2009. Total employment then trended upward until hitting a peak of 300,300 in January 2015. From January 2015 to December 2016, employment fell by 18,300 jobs as large layoffs were seen in coal mining and oil & gas industries. During the Covid-19 pandemic in 2020, employment fell sharply, and then rebounded.
Employment in Wyoming’s manufacturing sector generally increased from January 1990 to February 2001, when it peaked at 10,600 jobs. Employment then fell to 9,200 jobs in April 2003. Total nonfarm employment continued to increase during this time. Manufacturing employment then rose from 2003 to 2007. Job losses in Wyoming’s manufacturing sector were coincident with the Great Recession during 2007 to 2009. After growing for a few years, manufacturing employment fell again in 2015 and 2016. Manufacturing employment fell during the pandemic in 2020, but recovered fairly quickly.
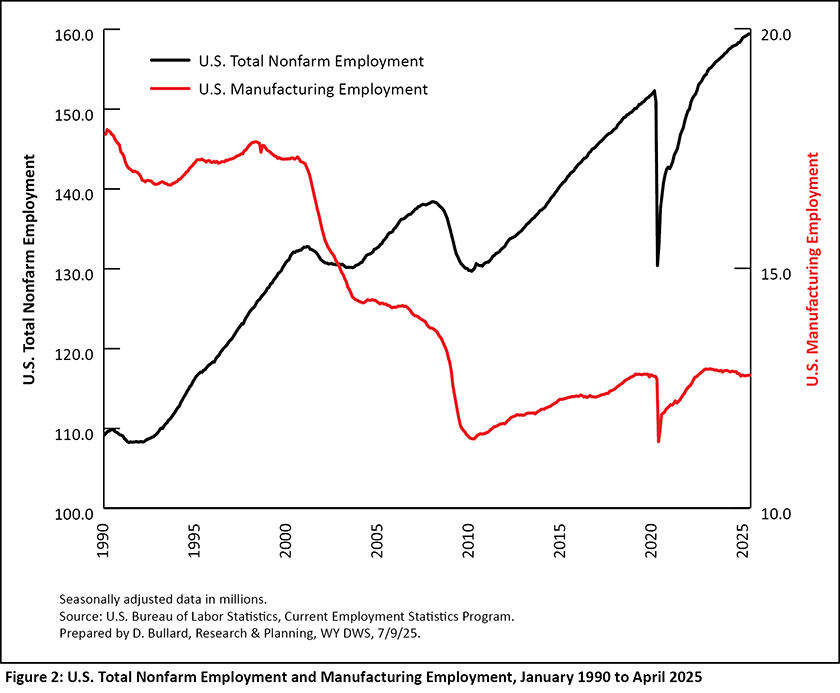
Figure 2 presents similar data for the United States. Total employment clearly trended upward during this period, increasing from 109.2 million jobs in January 1990 to 159.4 million jobs in April 2025. On the other hand, manufacturing employment fell from 17.8 million jobs to 12.8 million jobs. In other words, while total employment grew by more than 50 million jobs, manufacturing employment declined by 5 million jobs. In January 1990, manufacturing made up 16.3% of total U.S. employment, but by 2025, it only accounted for 8.0%. It appears that the periods of steepest decline in manufacturing employment were during recessions (both the Great Recession of 2007-2009 and the dot com recession of 2001).

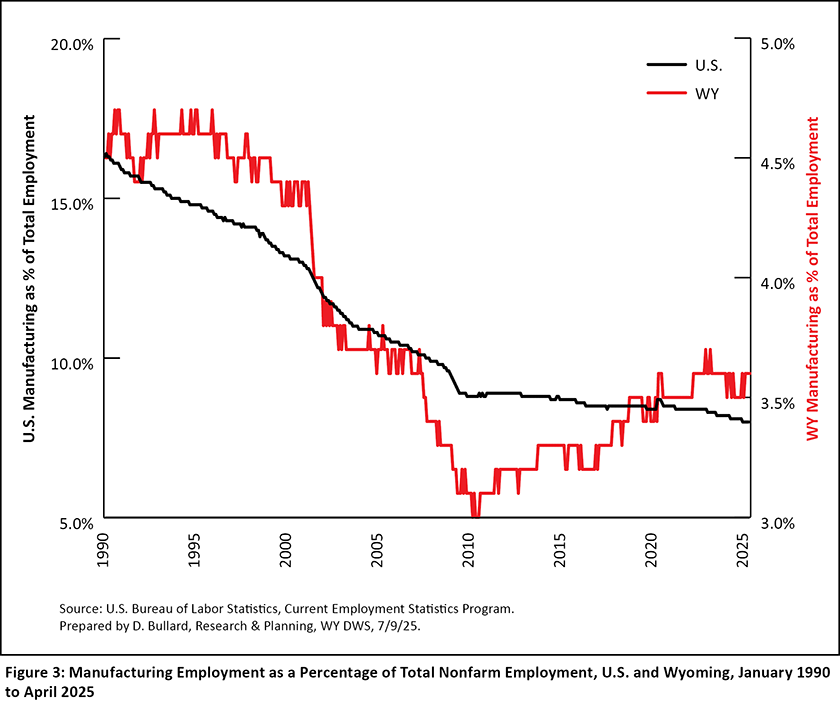
Figure 3 compares Wyoming to the U.S. in the percentage of employment in the manufacturing sector. The black line for the U.S. almost always trends down, which suggests that even when manufacturing employment rose (as can be seen in Figure 2 from 2010 to 2019), it grew slower than total nonfarm employment. On the other hand, in Wyoming, manufacturing rebounded slightly from 3.0% in June 2010 to 3.6% in April 2025.
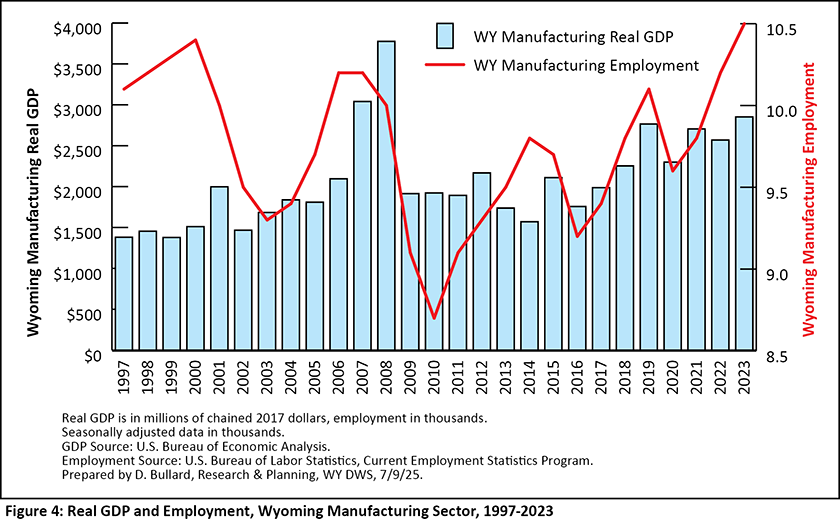
Figure 4 shows real gross domestic product (GDP) and employment for Wyoming’s manufacturing sector. Real GDP represents the total output of the manufacturing sector, expressed in real 2017 (inflation adjusted) dollars. Manufacturing firms in Wyoming produced more than twice as much output in 2023 ($2.9 billion) as they did in 1997 ($1.4 billion). Wyoming manufacturers doubled their output, while only employing 4.0% more workers.
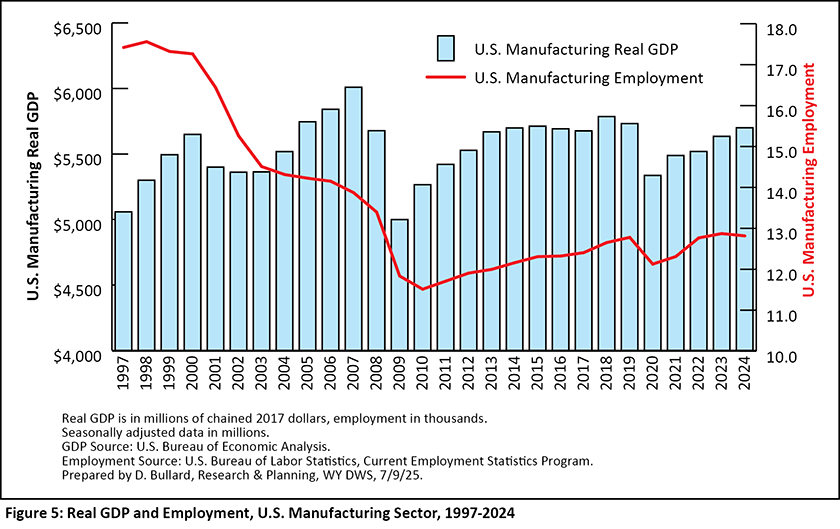
Real output in the U.S. manufacturing sector also increased from 1997 to present (see Figure 5). However, the gain was not as large as in Wyoming, as U.S. manufacturing output rose from $5.1 trillion in 1997 to $5.7 trillion in 2024, an increase of 12.7%. Because of increasing productivity, total output increased while employment fell. It seems particularly noteworthy that output increased each year from 2004 to 2007, even while employment fell.
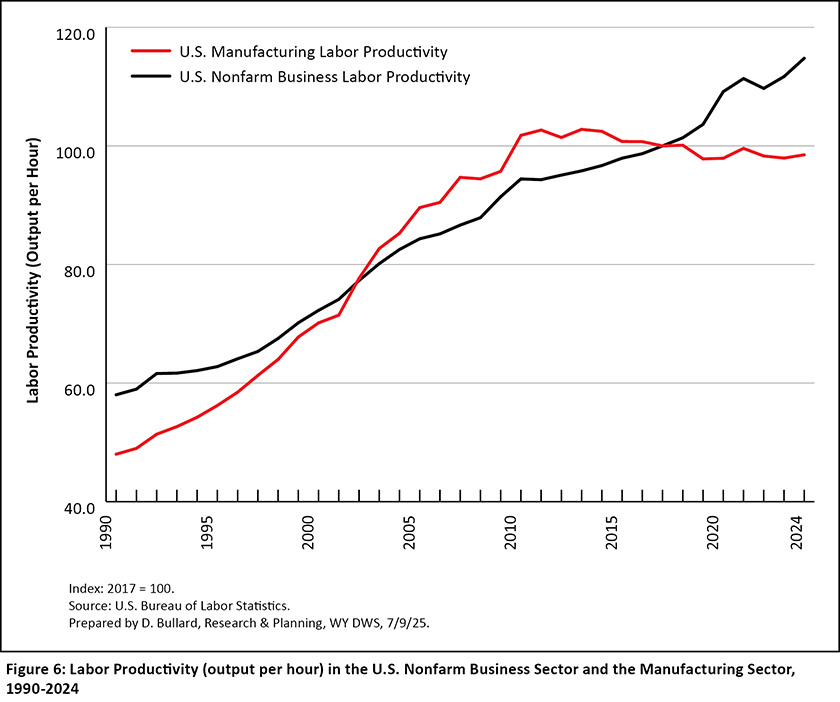
The U.S. Bureau of Labor Statistics publishes estimates of productivity. Productivity is defined as output per hour of work. Figure 6 shows that productivity in the U.S. manufacturing sector grew rapidly from 1990 to about 2011, but has remained stagnant since then. On the other hand, productivity in the nonfarm business sector grew much more steadily from 1990 to 2024, and continued to grow in the 2020s while manufacturing productivity was largely unchanged. Increases in productivity are likely related to improvements in technology, greater investment in capital, or a combination of both.
Conclusion
In summary, rising productivity has been an important force in the U.S. manufacturing sector. While U.S. manufacturing employment fell dramatically from 1990 to 2024, output rose significantly. In Wyoming, manufacturing employment rose while output more than doubled.
Both in Wyoming and in the U.S. manufacturing employment tended to move with the business cycle. Employment in manufacturing fell during recessions, but generally did not recover during expansions. This has resulted in manufacturing jobs making up a smaller part of total nonfarm employment than in the past.
From 1990 to 2024, the share of U.S. jobs in manufacturing has fallen from 16.3% to 8.0%, while in Wyoming it has fallen from 4.5% to 3.6%.
 Hire Wyo
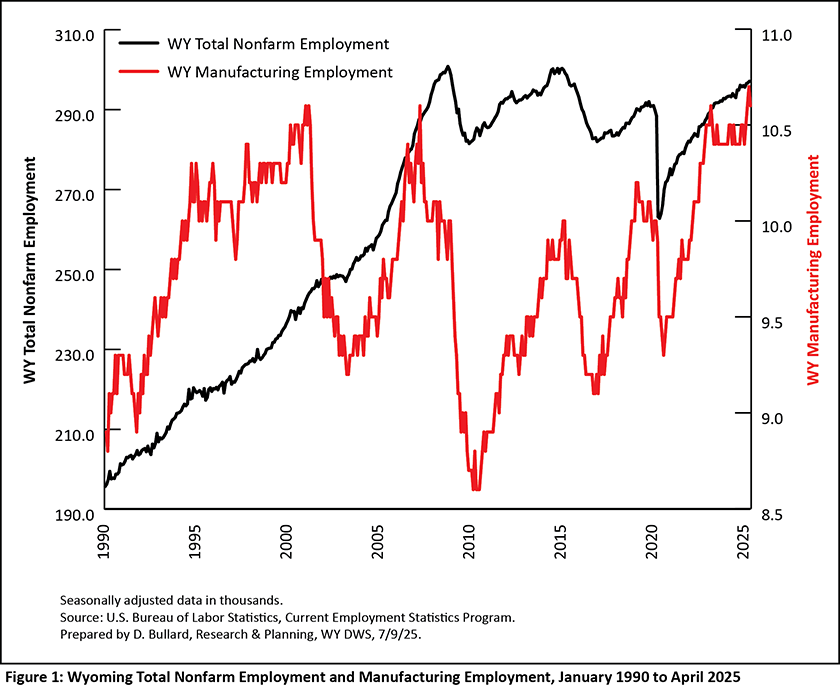