Economic Indicators
The Baker Hughes rig count for Wyoming increased 17.5% from June 2012 to June 2013.
|
Jun
2013 (p) |
May
2013 (r) |
Jun
2012 (b) |
Percent Change |
||||
|---|---|---|---|---|---|---|---|
| Month | Year | ||||||
| Wyoming Total Nonfarm Employment | 300,600 | 290,900 | 298,500 | 3.3 | 0.7 | ||
| Wyoming State Government | 16,700 | 17,800 | 16,700 | -6.2 | 0.0 | ||
| Laramie County Nonfarm Employment | 47,100 | 46,300 | 45,200 | 1.7 | 4.2 | ||
| Natrona County Nonfarm Employment | 41,800 | 41,400 | 42,000 | 1.0 | -0.5 | ||
| Selected U.S. Employment Data | |||||||
| U.S. Multiple Jobholders | 6,990,000 | 7,123,000 | 6,707,000 | -1.9 | 4.2 | ||
| As a percent of all workers | 4.8% | 4.9% | 4.7% | N/A | N/A | ||
| U.S. Discouraged Workers | 1,027,000 | 780,000 | 821,000 | 31.7 | 25.1 | ||
| U.S. Part Time for Economic Reasons | 8,440,000 | 7,618,000 | 8,394,000 | 10.8 | 0.5 | ||
| Wyoming Unemployment Insurance | |||||||
| Weeks Compensated | 14,624 | 18,710 | 15,519 | -21.8 | -5.8 | ||
| Benefits Paid | $5,206,739 | $6,579,671 | $5,319,736 | -20.9 | -2.1 | ||
| Average Weekly Benefit Payment | $356.04 | $351.67 | $342.79 | 1.2 | 3.9 | ||
| State Insured Covered Jobs1 | 278,101 | 269,961 | 276,720 | 3.0 | 0.5 | ||
| Insured Unemployment Rate | 2.1% | 2.5% | 2.1% | N/A | N/A | ||
| Consumer Price Index (U) for All U.S. Urban Consumers | |||||||
| (1982 to 1984 = 100) | |||||||
| All Items | 233.5 | 232.9 | 229.5 | 0.2 | 1.8 | ||
| Food & Beverages | 236.7 | 236.5 | 233.5 | 0.1 | 1.4 | ||
| Housing | 228.1 | 226.9 | 223.1 | 0.5 | 2.2 | ||
| Apparel | 126.2 | 128.0 | 125.2 | -1.4 | 0.8 | ||
| Transportation | 220.0 | 219.4 | 216.4 | 0.3 | 1.7 | ||
| Medical Care | 424.3 | 422.8 | 415.3 | 0.3 | 2.1 | ||
| Recreation (Dec. 1997=100) | 115.4 | 115.6 | 115.1 | -0.1 | 0.3 | ||
| Education & Comm. (Dec. 1997=100) | 135.1 | 135.2 | 133.5 | -0.1 | 1.2 | ||
| Other Goods & Services | 400.3 | 400.0 | 394.0 | 0.1 | 1.6 | ||
| Producer Prices (1982 to 1984 = 100) | |||||||
| All Commodities | 204.7 | 204.2 | 199.8 | 0.2 | 2.5 | ||
| Wyo. Bldg. Permits (New Privately Owned Housing Units Authorized) | |||||||
| Total Units | 259 | 333 | 159 | -22.2 | 62.9 | ||
| Valuation | $60,045,000 | $54,482,000 | $41,531,000 | 10.2 | 44.6 | ||
| Single Family Homes | 242 | 158 | 147 | 53.2 | 64.6 | ||
| Valuation | $58,927,000 | $40,764,000 | $40,278,000 | 44.6 | 46.3 | ||
| Casper MSA2 Building Permits | 36 | 31 | 26 | 16.1 | 38.5 | ||
| Valuation | $7,899,000 | $4,488,000 | $4,979,000 | 76.0 | 58.6 | ||
| Cheyenne MSA Building Permits | 62 | 193 | 34 | -67.9 | 82.4 | ||
| Valuation | $9,222,000 | $18,629,000 | $6,953,000 | -50.5 | 32.6 | ||
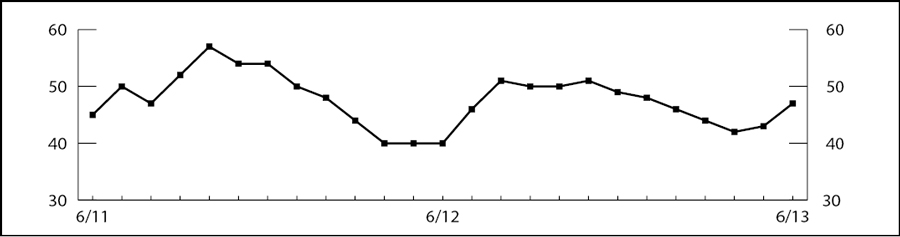
| Baker Hughes North American Rotary Rig Count for Wyoming | 47 | 43 | 40 | 9.3 | 17.5 | ||
Baker Hughes North American Rotary Rig Count for Wyoming
|
|||||||
| (p) Preliminary. (r) Revised. (b) Benchmarked. | |||||||
| 1Local Area Unemployment Statistics Program estimates. | |||||||
| 2Metropolitan Statistical Area. | |||||||
| Note: Production worker hours and earnings data have been dropped from the Economic Indicators page because of problems with accuracy due to a small sample size and high item nonresponse. The Bureau of Labor Statistics will continue to publish these data online at http://www.bls.gov/eag/eag.wy.htm. | |||||||