Economic Indicators
The number of discouraged workers in the U.S. fell 13.1% from March 2013 to March 2014.
| Mar | Feb | Mar | Percent Change | ||||
|---|---|---|---|---|---|---|---|
| 2014 (p) | 2014 (r) | 2013 (b) | Month | Year | |||
| Wyoming Total Nonfarm Employment | 286,800 | 283,900 | 283,400 | 1.0 | 1.2 | ||
| Wyoming State Government | 15,900 | 15,900 | 16,100 | 0.0 | -1.2 | ||
| Laramie County Nonfarm Employment | 45,300 | 44,400 | 44,700 | 2.0 | 1.3 | ||
| Natrona County Nonfarm Employment | 41,500 | 40,900 | 41,500 | 1.5 | 0.0 | ||
| Selected U.S. Employment Data | |||||||
| U.S. Multiple Jobholders | 7,143,000 | 7,163,000 | 7,192,000 | -0.3 | -0.7 | ||
| As a percent of all workers | 4.9% | 5.0% | 5.0% | N/A | N/A | ||
| U.S. Discouraged Workers | 698,000 | 755,000 | 803,000 | -7.5 | -13.1 | ||
| U.S. Part Time for Economic Reasons | 7,455,000 | 7,397,000 | 7,734,000 | 0.8 | -3.6 | ||
| Wyoming Unemployment Insurance | |||||||
| Weeks Compensated | 18,944 | 21,044 | 24,523 | -10.0 | -22.8 | ||
| Benefits Paid | $6,676,432 | $7,419,048 | $8,560,514 | -10.0 | -22.0 | ||
| Average Weekly Benefit Payment | $352.43 | $352.55 | $349.08 | 0.0 | 1.0 | ||
| State Insured Covered Jobs1 | 265,403 | 263,465 | 261,398 | 0.7 | 1.5 | ||
| Insured Unemployment Rate | 2.5% | 2.8% | 3.2% | N/A | N/A | ||
| Consumer Price Index (U) for All U.S. Urban Consumers | |||||||
| (1982 to 1984 = 100) | |||||||
| All Items | 236.3 | 234.8 | 232.8 | 0.6 | 1.5 | ||
| Food & Beverages | 240.2 | 239.5 | 236.3 | 0.3 | 1.7 | ||
| Housing | 232.0 | 230.9 | 225.6 | 0.5 | 2.8 | ||
| Apparel | 128.9 | 125.5 | 128.3 | 2.7 | 0.5 | ||
| Transportation | 218.4 | 214.7 | 221.1 | 1.8 | -1.2 | ||
| Medical Care | 433.4 | 432.8 | 424.2 | 0.1 | 2.2 | ||
| Recreation (Dec. 1997=100) | 115.8 | 115.7 | 115.4 | 0.1 | 0.3 | ||
| Education & Communication (Dec. 1997=100) | 137.1 | 137.0 | 135.6 | 0.1 | 1.1 | ||
| Other Goods & Services | 406.7 | 405.9 | 399.3 | 0.2 | 1.9 | ||
| Producer Prices (1982 to 1984 = 100) | |||||||
| All Commodities | 207.0 | 206.0 | 204.0 | 0.5 | 1.5 | ||
| Wyo. Bldg. Permits (New Privately Owned Housing Units Authorized) | |||||||
| Total Units | 110 | 122 | 135 | -9.8 | -18.5 | ||
| Valuation | $30,211,000 | $37,110,000 | $32,367,000 | -18.6 | -6.7 | ||
| Single Family Homes | 103 | 97 | 115 | 6.2 | -10.4 | ||
| Valuation | $29,541,000 | $35,297,000 | $32,017,000 | -16.3 | -7.7 | ||
| Casper MSA2 Building Permits | 20 | 37 | 35 | -45.9 | -42.9 | ||
| Valuation | $4,040,000 | $4,908,000 | $7,182,000 | -17.7 | -43.7 | ||
| Cheyenne MSA Building Permits | 24 | 24 | 21 | 0.0 | 14.3 | ||
| Valuation | $4,286,000 | $4,740,000 | $3,724,000 | -9.6 | 15.1 | ||
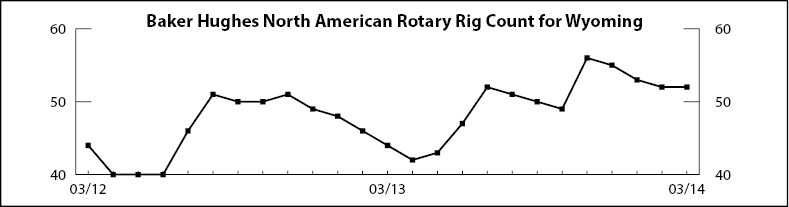
| Baker Hughes North American Rotary Rig Count for Wyoming | 52 | 52 | 44 | 0.0 | 18.2 | ||
| (p) Preliminary. (r) Revised. (b) Benchmarked. | |||||||
| 1Local Area Unemployment Statistics Program estimates. | |||||||
| 2Metropolitan Statistical Area. | |||||||
| Note: Production worker hours and earnings data have been dropped from the Economic Indicators page because of problems with accuracy due to a small sample size and high item nonresponse. The Bureau of Labor Statistics will continue to publish these data online at http://www.bls.gov/eag/eag.wy.htm. | |||||||