Initial
Claims |
Claims Filed
|
% Change
Claims Filed |
Feb
16 |
Feb
16 |
Feb
16 |
Jan
16 |
Feb
15 |
Jan
16 |
Feb
15 |
Wyoming
Statewide |
|
|
|
|
|
|
|
|
|
|
|
|
TOTAL CLAIMS FILED |
3,829
|
4,874
|
3,475
|
-21.4
|
10.2
|
|
|
|
|
|
|
|
|
TOTAL GOODS-PRODUCING |
2,017
|
2,366
|
1,963
|
-14.8
|
2.8
|
|
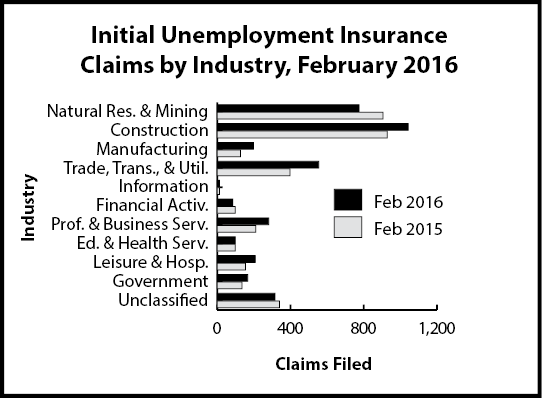
Natural Res. & Mining
|
775
|
614
|
905
|
26.2
|
-14.4
|
|
Mining |
758
|
592
|
899
|
28.0
|
-15.7
|
|
Oil & Gas Extraction
|
32
|
31
|
57
|
3.2
|
-43.9
|
|
Construction |
1,043
|
1,517
|
929
|
-31.2
|
12.3
|
|
Manufacturing |
198
|
233
|
127
|
-15.0
|
55.9
|
|
TOTAL SERVICE-PROVIDING |
1,330
|
1,735
|
1,035
|
-23.3
|
28.5
|
|
Trade, Transp., & Utilities
|
554
|
651
|
397
|
-14.9
|
39.5
|
|
Wholesale Trade |
156
|
138
|
72
|
13.0
|
116.7
|
|
Retail Trade |
179
|
282
|
148
|
-36.5
|
20.9
|
|
Transp., Warehousing & Utilities
|
219
|
231
|
177
|
-5.2
|
23.7
|
|
Information |
12
|
17
|
12
|
-29.4
|
0.0
|
|
Financial Activities |
85
|
84
|
99
|
1.2
|
-14.1
|
|
Prof. & Business Svcs.
|
281
|
415
|
211
|
-32.3
|
33.2
|
|
Educational & Health Svcs.
|
99
|
110
|
99
|
-10.0
|
0.0
|
|
Leisure & Hospitality
|
208
|
349
|
155
|
-40.4
|
34.2
|
|
Other Svcs., exc. Public Admin. |
84
|
102
|
57
|
-17.6
|
47.4
|
|
TOTAL GOVERNMENT |
166
|
362
|
135
|
-54.1
|
23.0
|
|
Federal Government |
51
|
125
|
60
|
-59.2
|
-15.0
|
|
State Government |
19
|
32
|
11
|
-40.6
|
72.7
|
|
Local Government |
95
|
204
|
62
|
-53.4
|
53.2
|
|
Local Education |
16
|
21
|
16
|
-23.8
|
0.0
|
|
UNCLASSIFIED |
315
|
410
|
340
|
-23.2
|
-7.4
|
|
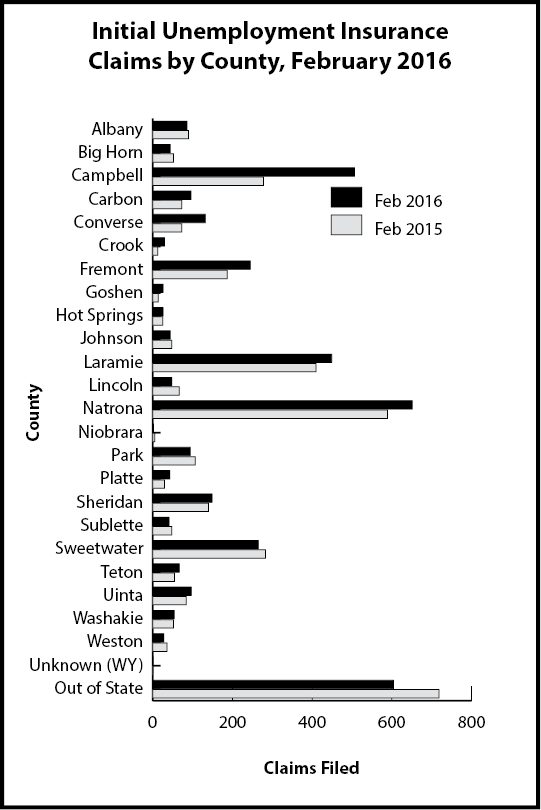
Laramie County |
|
|
|
|
|
|
TOTAL CLAIMS FILED |
449
|
497
|
410
|
-9.7
|
9.5
|
|
TOTAL GOODS-PRODUCING |
217
|
261
|
208
|
-16.9
|
4.3
|
|
Construction |
147
|
210
|
148
|
-30.0
|
-0.7
|
|
TOTAL SERVICE-PROVIDING |
198
|
197
|
154
|
0.5
|
28.6
|
|
Trade, Transp., & Utilities
|
80
|
76
|
52
|
5.3
|
53.8
|
|
Financial Activities |
7
|
14
|
10
|
-50.0
|
-30.0
|
|
Prof. & Business Svcs.
|
54
|
44
|
39
|
22.7
|
38.5
|
|
Educational & Health Svcs.
|
20
|
23
|
29
|
-13.0
|
-31.0
|
|
Leisure & Hospitality
|
20
|
22
|
13
|
-9.1
|
53.8
|
|
TOTAL GOVERNMENT |
18
|
20
|
20
|
-10.0
|
-10.0
|
|
UNCLASSIFIED |
15
|
18
|
25
|
-16.7
|
-40.0
|
|
Natrona County |
|
|
|
|
|
|
TOTAL CLAIMS FILED |
650
|
799
|
588
|
-18.6
|
10.5
|
|
TOTAL GOODS-PRODUCING |
346
|
434
|
370
|
-20.3
|
-6.5
|
|
Construction |
162
|
279
|
147
|
-41.9
|
10.2
|
|
TOTAL SERVICE-PROVIDING |
277
|
330
|
191
|
-16.1
|
45.0
|
|
Trade, Transp., & Utilities
|
123
|
144
|
73
|
-14.6
|
68.5
|
|
Financial Activities |
23
|
12
|
16
|
91.7
|
43.8
|
|
Prof. & Business Svcs.
|
46
|
70
|
35
|
-34.3
|
31.4
|
|
Educational & Health Svcs.
|
21
|
17
|
23
|
23.5
|
-8.7
|
|
Leisure & Hospitality
|
24
|
52
|
27
|
-53.8
|
-11.1
|
|
TOTAL GOVERNMENT |
9
|
14
|
15
|
-35.7
|
-40.0
|
|
UNCLASSIFIED |
17
|
21
|
11
|
-19.0
|
54.5
|