
Economic Indicators
The consumer price index for transportation decreased 9.7% from February 2014 to February 2015 largely because of falling gasoline prices.
| Feb | Jan | Feb | Percent Change | ||||
|---|---|---|---|---|---|---|---|
|
2015 (p) |
2015 (r) |
2014 (b) |
Month | Year | |||
| Wyoming Total Nonfarm Employment | 286,500 | 286,700 | 282,500 | -0.1 | 1.4 | ||
| Wyoming State Government | 15,700 | 15,400 | 15,900 | 1.9 | -1.3 | ||
| Laramie County Nonfarm Employment | 47,300 | 46,700 | 45,500 | 1.3 | 4.0 | ||
| Natrona County Nonfarm Employment | 42,600 | 43,100 | 41,900 | -1.2 | 1.7 | ||
| Selected U.S. Employment Data | |||||||
| U.S. Multiple Jobholders | 7,221,000 | 7,289,000 | 7,163,000 | -0.9 | 0.8 | ||
| As a percent of all workers | 4.9% | 5.0% | 5.0% | N/A | N/A | ||
| U.S. Discouraged Workers | 732,000 | 682,000 | 755,000 | 7.3 | -3.0 | ||
| U.S. Part Time for Economic Reasons | 6,772,000 | 7,269,000 | 7,397,000 | -6.8 | -8.4 | ||
| Wyoming Unemployment Insurance | |||||||
| Weeks Compensated | 19,638 | 18,667 | 21,044 | 5.2 | -6.7 | ||
| Benefits Paid | $7,420,775 | $6,931,523 | $7,419,048 | 7.1 | 0.0 | ||
| Average Weekly Benefit Payment | $377.88 | $371.32 | $352.55 | 1.8 | 7.2 | ||
| State Insured Covered Jobs1 | 267,975 | 267,812 | 262,879 | 0.1 | 1.9 | ||
| Insured Unemployment Rate | 2.7% | 2.4% | 2.8% | N/A | N/A | ||
| Consumer Price Index (U) for All U.S. Urban Consumers | |||||||
| (1982 to 1984 = 100) | |||||||
| All Items | 234.7 | 233.7 | 234.8 | 0.4 | 0.0 | ||
| Food & Beverages | 246.3 | 246.1 | 239.5 | 0.1 | 2.8 | ||
| Housing | 236.0 | 235.5 | 230.9 | 0.2 | 2.2 | ||
| Apparel | 124.5 | 122.5 | 125.5 | 1.6 | -0.8 | ||
| Transportation | 193.9 | 190.9 | 214.7 | 1.6 | -9.7 | ||
| Medical Care | 442.8 | 441.0 | 432.8 | 0.4 | 2.3 | ||
| Recreation (Dec. 1997=100) | 115.6 | 115.3 | 115.7 | 0.3 | -0.1 | ||
| Education & Communication (Dec. 1997=100) | 137.6 | 137.6 | 137.0 | 0.0 | 0.4 | ||
| Other Goods & Services | 411.8 | 412.5 | 405.9 | -0.2 | 1.5 | ||
| Producer Prices (1982 to 1984 = 100) | |||||||
| All Commodities | 191.1 | 192.1 | 205.7 | -0.5 | -7.1 | ||
| Wyo. Bldg. Permits (New Privately Owned Housing Units Authorized) | |||||||
| Total Units | 98 | 70 | 122 | 40.0 | -19.7 | ||
| Valuation | $33,392,000 | $16,357,000 | $37,110,000 | 104.1 | -10.0 | ||
| Single Family Homes | 95 | 61 | 97 | 55.7 | -2.1 | ||
| Valuation | $33,017,000 | $15,464,000 | $35,297,000 | 113.5 | -6.5 | ||
| Casper MSA2 Building Permits | 14 | 23 | 37 | -39.1 | -62.2 | ||
| Valuation | $3,054,000 | $5,260,000 | $4,908,000 | -41.9 | -37.8 | ||
| Cheyenne MSA Building Permits | 19 | 10 | 24 | 90.0 | -20.8 | ||
| Valuation | $3,643,000 | $1,491,000 | $4,740,000 | 144.3 | -23.1 | ||
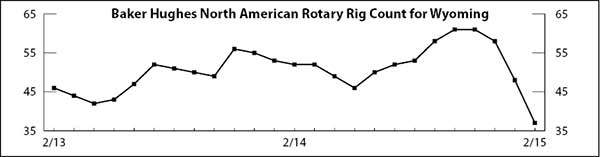
| Baker Hughes North American Rotary Rig Count for Wyoming | 37 | 48 | 52 | -22.9 | -28.8 | ||
|
|||||||
|
(p) Preliminary. (r) Revised. (b) Benchmarked. 1Local Area Unemployment Statistics Program estimates. 2Metropolitan Statistical Area. Note: Production worker hours and earnings data have been dropped from the Economic Indicators page because of problems with accuracy due to a small sample size and high item nonresponse. The U.S. Bureau of Labor Statistics will continue to publish these data online at http://www.bls.gov/eag/eag.wy.htm. |
|||||||