Local Jobs and Payroll in Wyoming: Sharp Slowdown
in Job Growth in Third Quarter 2012
Tables 1, 2, 3, 4, Natrona County, Laramie County
Figures 1, 2
Note: Due to space considerations, the Natrona County and Laramie County tables are not included in the print version of this issue of Wyoming Labor Force Trends.
|
Average Monthly Employment Percentage Change Over the Previous |
Total Wages Percentage Change Over the Previous |
Average Weekly Wage Percentage Change Over the Previous |
||||
|---|---|---|---|---|---|---|
| Year | Quarter | Year | Quarter | Year | Quarter | |
| 2008Q3 | 3.4 | 2.1 | 10.1 | 2.3 | 6.5 | 0.2 |
| 2009Q3 | -5.3 | 0.1 | -8.4 | -1.3 | -3.2 | -1.5 |
| 2010Q3 | 0.0 | 1.9 | 4.8 | 2.3 | 4.8 | 0.3 |
| 2011Q3 | 1.4 | 2.6 | 6.5 | 4.1 | 5.0 | 1.5 |
| 2012Q3a | 0.6 | 1.0 | 0.1 | -0.6 | -0.5 | -1.5 |
| Five-Year Average for Q3 | 0.0 | 1.5 | 2.6 | 1.4 | 2.5 | -0.2 |
| aPreliminary. | ||||||
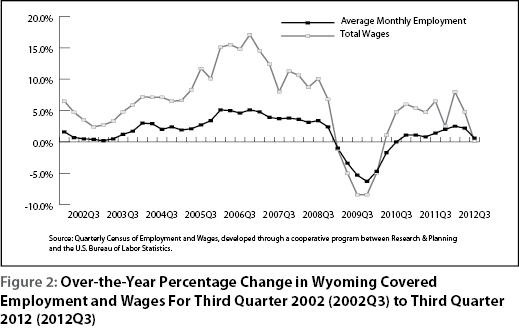
| Source: Quarterly Census of Employment and Wages, developed through a cooperative program between Research & Planning and the U.S. Bureau of Labor Statistics. | ||||||
| Extract date: January 2013. | ||||||
| Year and Quarter |
Average Monthly Employment |
Total Wages |
|---|---|---|
| 2004Q1 | 3.0 | 7.2 |
| 2004Q2 | 2.9 | 7.1 |
| 2004Q3 | 2.0 | 7.1 |
| 2004Q4 | 2.4 | 6.5 |
| 2005Q1 | 1.9 | 6.6 |
| 2005Q2 | 2.1 | 8.3 |
| 2005Q3 | 2.7 | 11.7 |
| 2005Q4 | 3.4 | 10.1 |
| 2006Q1 | 5.1 | 15.1 |
| 2006Q2 | 5.0 | 15.5 |
| 2006Q3 | 4.6 | 14.8 |
| 2006Q4 | 5.1 | 17.1 |
| 2007Q1 | 4.8 | 14.5 |
| 2007Q2 | 3.9 | 12.4 |
| 2007Q3 | 3.7 | 8.0 |
| 2007Q4 | 3.8 | 11.3 |
| 2008Q1 | 3.6 | 10.6 |
| 2008Q2 | 3.1 | 8.7 |
| 2008Q3 | 3.4 | 10.1 |
| 2008Q4 | 2.4 | 6.8 |
| 2009Q1 | -1.0 | -1.2 |
| 2009Q2 | -3.4 | -5.0 |
| 2009Q3 | -5.3 | -8.4 |
| 2009Q4 | -6.3 | -8.4 |
| 2010Q1 | -4.7 | -4.9 |
| 2010Q2 | -1.7 | 1.1 |
| 2010Q3 | 0.0 | 4.8 |
| 2010Q4 | 1.1 | 6.0 |
| 2011Q1 | 1.1 | 5.4 |
| 2011Q2 | 0.8 | 4.7 |
| 2011Q3 | 1.4 | 6.5 |
| 2011Q4 | 2.0 | 2.5 |
| 2012Q1 | 2.5 | 8.0 |
| 2012Q2 | 2.2 | 4.8 |
| 2012Q3a | 0.6 | 0.1 |
| aPreliminary. | ||
| Source: Quarterly Census of Employment and Wages, developed through a cooperative program between Research & Planning and the U.S. Bureau of Labor Statistics. | ||
| Extract date: January 2013. | ||
| Average Monthly Employment | Total Payroll | Average Weekly Wage | ||||||||||
|---|---|---|---|---|---|---|---|---|---|---|---|---|
| Third Quarter | Change | Third Quarter | Change | Third Quarter | Change | |||||||
| 2011 | 2012 | n | % | 2011 | 2012 | $ | % | 2011 | 2012 | $ | % | |
| Total | 282,231 | 283,880 | 1,649 | 0.6 | $3,053,914,162 | $3,056,627,056 | $2,712,894 | 0.1 | $832 | $828 | -$4 | -0.5 |
| Albany | 15,321 | 15,216 | -105 | -0.7 | $143,482,983 | $140,457,575 | -$3,025,408 | -2.1 | $720 | $710 | -$10 | -1.4 |
| Big Horn | 4,438 | 4,333 | -105 | -2.4 | 38,929,711 | 37,979,593 | -950,118 | -2.4 | 675 | 674 | -1 | -0.1 |
| Campbell | 27,168 | 27,451 | 283 | 1.0 | 375,730,224 | 367,243,007 | -8,487,217 | -2.3 | 1,064 | 1,029 | -35 | -3.3 |
| Carbon | 6,883 | 7,131 | 248 | 3.6 | 66,351,744 | 71,882,529 | 5,530,785 | 8.3 | 742 | 775 | 33 | 4.4 |
| Converse | 5,537 | 5,839 | 302 | 5.5 | 60,100,058 | 64,368,966 | 4,268,908 | 7.1 | 835 | 848 | 13 | 1.6 |
| Crook | 2,370 | 2,382 | 12 | 0.5 | 20,784,549 | 21,221,455 | 436,906 | 2.1 | 675 | 685 | 10 | 1.5 |
| Fremont | 16,838 | 16,898 | 60 | 0.4 | 160,574,038 | 162,583,205 | 2,009,167 | 1.3 | 734 | 740 | 6 | 0.8 |
| Goshen | 4,533 | 4,528 | -5 | -0.1 | 35,438,135 | 35,529,000 | 90,865 | 0.3 | 601 | 604 | 3 | 0.5 |
| Hot Springs | 2,189 | 2,163 | -26 | -1.2 | 17,952,134 | 17,578,400 | -373,734 | -2.1 | 631 | 625 | -6 | -1.0 |
| Johnson | 3,393 | 3,435 | 42 | 1.2 | 26,961,616 | 27,681,549 | 719,933 | 2.7 | 611 | 620 | 9 | 1.5 |
| Laramie | 43,566 | 43,989 | 423 | 1.0 | 456,356,981 | 454,286,294 | -2,070,687 | -0.5 | 806 | 794 | -12 | -1.5 |
| Lincoln | 6,147 | 5,698 | -449 | -7.3 | 63,651,537 | 56,286,176 | -7,365,361 | -11.6 | 797 | 760 | -37 | -4.6 |
| Natrona | 39,835 | 41,186 | 1,351 | 3.4 | 463,873,544 | 483,274,207 | 19,400,663 | 4.2 | 896 | 903 | 7 | 0.8 |
| Niobrara | 898 | 924 | 26 | 2.9 | 6,667,039 | 6,657,978 | -9,061 | -0.1 | 571 | 554 | -17 | -3.0 |
| Park | 15,328 | 15,596 | 268 | 1.7 | 135,482,694 | 134,152,343 | -1,330,351 | -1.0 | 680 | 662 | -18 | -2.6 |
| Platte | 3,403 | 3,232 | -171 | -5.0 | 32,324,389 | 29,979,699 | -2,344,690 | -7.3 | 731 | 714 | -17 | -2.3 |
| Sheridan | 13,021 | 12,975 | -46 | -0.4 | 118,044,361 | 118,605,136 | 560,775 | 0.5 | 697 | 703 | 6 | 0.9 |
| Sublette | 6,274 | 5,409 | -865 | -13.8 | 92,332,741 | 71,955,568 | -20,377,173 | -22.1 | 1,132 | 1,023 | -109 | -9.6 |
| Sweetwater | 24,969 | 24,866 | -103 | -0.4 | 337,721,870 | 335,255,704 | -2,466,166 | -0.7 | 1,040 | 1,037 | -3 | -0.3 |
| Teton | 20,008 | 20,181 | 173 | 0.9 | 184,573,391 | 187,795,916 | 3,222,525 | 1.7 | 710 | 716 | 6 | 0.8 |
| Uinta | 9,017 | 9,078 | 61 | 0.7 | 91,668,368 | 90,815,826 | -852,542 | -0.9 | 782 | 770 | -12 | -1.5 |
| Washakie | 3,998 | 3,970 | -28 | -0.7 | 37,850,736 | 37,291,391 | -559,345 | -1.5 | 728 | 723 | -5 | -0.7 |
| Weston | 2,254 | 2,306 | 52 | 2.3 | 19,168,312 | 19,926,847 | 758,535 | 4.0 | 654 | 665 | 11 | 1.7 |
| Nonclassifiedb | 4,843 | 5,094 | 251 | 5.2 | 67,893,007 | 83,818,692 | 15,925,685 | 23.5 | 1,078 | 1,266 | 187 | 17.4 |
| aPreliminary. | ||||||||||||
| bThe employer may be located statewide or in more than one county. | ||||||||||||
| Source: Quarterly Census of Employment and Wages, developed through a cooperative program between Research & Planning and the U.S. Bureau of Labor Statistics. | ||||||||||||
| Extract date: January 2013. | ||||||||||||
| Average Monthly Employment | Total Payroll | Average Weekly Wage | ||||||||||
|---|---|---|---|---|---|---|---|---|---|---|---|---|
| Third Quarter | Change | Third Quarter | Change | Third Quarter | Change | |||||||
| NAICSb Title | 2011 | 2012 | n | % | 2011 | 2012 | $ | % | 2011 | 2012 | $ | % |
| Total, All Industries | 282,231 | 283,880 | 1,649 | 0.6 | $3,053,914,162 | $3,056,627,056 | $2,712,894 | 0.1 | $832 | $828 | -$4 | -0.5 |
| Total Private | 219,943 | 220,828 | 885 | 0.4 | $2,353,566,650 | $2,345,735,947 | -$7,830,703 | -0.3 | $823 | $817 | -$6 | -0.7 |
| Agriculture | 2,733 | 2,752 | 19 | 0.7 | 19,001,613 | 19,450,564 | 448,951 | 2.4 | 535 | 544 | 9 | 1.7 |
| Mining | 27,998 | 27,537 | -461 | -1.6 | 560,144,403 | 550,013,584 | -10,130,819 | -1.8 | 1,539 | 1,536 | -3 | -0.2 |
| Utilities | 2,486 | 2,472 | -14 | -0.6 | 53,777,187 | 49,186,918 | -4,590,269 | -8.5 | 1,664 | 1,531 | -133 | -8.0 |
| Construction | 23,259 | 23,331 | 72 | 0.3 | 283,882,968 | 286,139,399 | 2,256,431 | 0.8 | 939 | 943 | 4 | 0.4 |
| Manufacturing | 9,320 | 9,435 | 115 | 1.2 | 133,281,143 | 127,187,829 | -6,093,314 | -4.6 | 1,100 | 1,037 | -63 | -5.7 |
| Wholesale Trade | 8,913 | 9,185 | 272 | 3.1 | 124,713,597 | 127,664,873 | 2,951,276 | 2.4 | 1,076 | 1,069 | -7 | -0.7 |
| Retail Trade | 30,106 | 30,203 | 97 | 0.3 | 199,288,884 | 198,922,443 | -366,441 | -0.2 | 509 | 507 | -2 | -0.4 |
| Transportation & Warehousing | 9,564 | 9,574 | 10 | 0.1 | 115,779,947 | 113,344,051 | -2,435,896 | -2.1 | 931 | 911 | -20 | -2.1 |
| Information | 3,865 | 3,936 | 71 | 1.8 | 40,460,996 | 39,704,052 | -756,944 | -1.9 | 805 | 776 | -29 | -3.6 |
| Finance & Insurance | 6,681 | 6,666 | -15 | -0.2 | 80,348,463 | 80,931,610 | 583,147 | 0.7 | 925 | 934 | 9 | 1.0 |
| Real Estate & Rental & Leasing | 4,094 | 4,194 | 100 | 2.4 | 41,110,621 | 43,738,522 | 2,627,901 | 6.4 | 772 | 802 | 30 | 3.9 |
| Professional & Technical Services | 9,140 | 9,187 | 47 | 0.5 | 121,858,707 | 126,845,416 | 4,986,709 | 4.1 | 1,026 | 1,062 | 36 | 3.5 |
| Mgmt. of Companies & Enterprises | 862 | 986 | 124 | 14.4 | 17,369,322 | 19,507,776 | 2,138,454 | 12.3 | 1,550 | 1,522 | -28 | -1.8 |
| Administrative & Waste Services | 8,845 | 8,488 | -357 | -4.0 | 65,785,673 | 64,563,249 | -1,222,424 | -1.9 | 572 | 585 | 13 | 2.3 |
| Educational Services | 1,700 | 1,664 | -36 | -2.1 | 13,535,761 | 12,991,535 | -544,226 | -4.0 | 612 | 601 | -11 | -1.8 |
| Health Care & Social Assistance | 23,537 | 23,634 | 97 | 0.4 | 234,271,528 | 230,699,534 | -3,571,994 | -1.5 | 766 | 751 | -15 | -2.0 |
| Ambulatory Health Care Services | 8,999 | 9,310 | 311 | 3.5 | 124,425,746 | 125,224,668 | 798,922 | 0.6 | 1,064 | 1,035 | -29 | -2.7 |
| Hospitals | 3,279 | 3,081 | -198 | -6.0 | 41,608,797 | 38,286,546 | -3,322,251 | -8.0 | 976 | 956 | -20 | -2.0 |
| Nursing & Res. Care Facilities | 4,592 | 4,575 | -17 | -0.4 | 33,105,428 | 32,204,329 | -901,099 | -2.7 | 555 | 541 | -14 | -2.5 |
| Social Assistance | 6,667 | 6,668 | 1 | 0.0 | 35,131,557 | 34,983,991 | -147,566 | -0.4 | 405 | 404 | -1 | -0.2 |
| Arts, Entertainment, & Recreation | 3,494 | 3,481 | -13 | -0.4 | 19,221,491 | 16,803,668 | -2,417,823 | -12.6 | 423 | 371 | -52 | -12.3 |
| Accommodation & Food Services | 34,731 | 35,277 | 546 | 1.6 | 155,709,027 | 160,288,075 | 4,579,048 | 2.9 | 345 | 350 | 5 | 1.4 |
| Other Services | 8,615 | 8,827 | 212 | 2.5 | 74,025,319 | 77,752,849 | 3,727,530 | 5.0 | 661 | 678 | 17 | 2.6 |
| Total Government | 62,288 | 63,051 | 763 | 1.2 | $700,347,512 | $710,891,109 | $10,543,597 | 1.5 | $865 | $867 | $2 | 0.2 |
| Federal Government | 8,360 | 8,355 | -5 | -0.1 | 119,879,493 | 123,101,516 | 3,222,023 | 2.7 | 1,103 | 1,133 | 30 | 2.7 |
| State Government | 13,587 | 13,551 | -36 | -0.3 | 175,481,845 | 175,281,359 | -200,486 | -0.1 | 993 | 995 | 2 | 0.2 |
| State Government Education | 3,883 | 3,809 | -74 | -1.9 | 48,766,292 | 47,500,810 | -1,265,482 | -2.6 | 966 | 959 | -7 | -0.7 |
| Local Government | 40,341 | 41,146 | 805 | 2.0 | 404,986,174 | 412,508,234 | 7,522,060 | 1.9 | 772 | 771 | -1 | -0.1 |
| Local Government Education | 17,583 | 17,805 | 222 | 1.3 | 171,857,947 | 173,021,462 | 1,163,515 | 0.7 | 752 | 748 | -4 | -0.6 |
| Hospitals | 6,622 | 6,923 | 301 | 4.5 | 88,209,619 | 90,224,945 | 2,015,326 | 2.3 | 1,025 | 1,003 | -22 | -2.2 |
| aPreliminary. | ||||||||||||
| bNorth American Industry Classification System. | ||||||||||||
| Source: Quarterly Census of Employment and Wages, developed through a cooperative program between Research & Planning and the U.S. Bureau of Labor Statistics. | ||||||||||||
| Extract date: January 2013. | ||||||||||||
| NAICSb Title | Average Monthly Employment | Total Payroll | Average Weekly Wage | |||||||||
|---|---|---|---|---|---|---|---|---|---|---|---|---|
| Third Quarter | Change | Third Quarter | Change | Third Quarter | Change | |||||||
| 2011 | 2012 | n | % | 2011 | 2012 | $ | % | 2011 | 2012 | $ | % | |
| Total, All Industries | 39,835 | 41,186 | 1,351 | 3.4 | $463,873,544 | $483,274,207 | $19,400,663 | 4.2 | $896 | $903 | $7 | 0.8 |
| Total Private | 34,445 | 35,779 | 1,334 | 3.9 | $398,111,329 | $417,329,371 | $19,218,042 | 4.8 | $889 | $897 | $8 | 0.9 |
| Agriculture | 127 | 127 | 0 | 0.0 | 749,983 | 763,805 | 13,822 | 1.8 | 454 | 463 | 9 | 2.0 |
| Mining | 3,910 | 4,049 | 139 | 3.6 | 84,526,187 | 88,424,890 | 3,898,703 | 4.6 | 1,663 | 1,680 | 17 | 1.0 |
| Utilities | 134 | 136 | 2 | 1.5 | 3,111,937 | 2,384,126 | -727,811 | -23.4 | 1,786 | 1,348 | -438 | -24.5 |
| Construction | 2,819 | 3,090 | 271 | 9.6 | 35,834,505 | 40,064,682 | 4,230,177 | 11.8 | 978 | 997 | 19 | 1.9 |
| Manufacturing | 1,769 | 1,861 | 92 | 5.2 | 21,396,793 | 23,270,120 | 1,873,327 | 8.8 | 930 | 962 | 32 | 3.4 |
| Wholesale Trade | 2,510 | 2,732 | 222 | 8.8 | 36,898,104 | 40,014,322 | 3,116,218 | 8.4 | 1,131 | 1,127 | -4 | -0.4 |
| Retail Trade | 4,736 | 4,791 | 55 | 1.2 | 33,620,535 | 33,565,056 | -55,479 | -0.2 | 546 | 539 | -7 | -1.3 |
| Transportation & Warehousing | 1,027 | 1,156 | 129 | 12.6 | 13,870,429 | 15,962,234 | 2,091,805 | 15.1 | 1,039 | 1,062 | 23 | 2.2 |
| Information | 476 | 469 | -7 | -1.5 | 4,873,821 | 4,674,704 | -199,117 | -4.1 | 788 | 767 | -21 | -2.7 |
| Finance & Insurance | 1,010 | 1,046 | 36 | 3.6 | 13,926,547 | 13,646,314 | -280,233 | -2.0 | 1,061 | 1,004 | -57 | -5.4 |
| Real Estate & Rental & Leasing | 901 | 941 | 40 | 4.4 | 10,722,052 | 12,923,719 | 2,201,667 | 20.5 | 915 | 1,056 | 141 | 15.4 |
| Professional & Technical Services | 1,425 | 1,481 | 56 | 3.9 | 19,698,077 | 20,492,936 | 794,859 | 4.0 | 1,063 | 1,064 | 1 | 0.1 |
| Mgmt. of Companies & Enterprises | 145 | 219 | 74 | 51.0 | 3,036,959 | 3,861,527 | 824,568 | 27.2 | 1,611 | 1,356 | -255 | -15.8 |
| Administrative & Waste Services | 1,485 | 1,443 | -42 | -2.8 | 11,296,459 | 11,570,605 | 274,146 | 2.4 | 585 | 617 | 32 | 5.5 |
| Educational Services | 116 | 121 | 5 | 4.3 | 710,191 | 885,224 | 175,033 | 24.6 | 471 | 563 | 92 | 19.5 |
| Health Care & Social Assistance | 5,588 | 5,576 | -12 | -0.2 | 64,439,678 | 64,399,976 | -39,702 | -0.1 | 887 | 888 | 1 | 0.1 |
| Ambulatory Health Care Services | 1,879 | 2,016 | 137 | 7.3 | 30,121,270 | 31,416,311 | 1,295,041 | 4.3 | 1,233 | 1,199 | -34 | -2.8 |
| Hospitals | 1,746 | 1,619 | -127 | -7.3 | 21,856,590 | 20,815,273 | -1,041,317 | -4.8 | 963 | 989 | 26 | 2.7 |
| Nursing & Res. Care Facilities | 927 | 904 | -23 | -2.5 | 7,027,916 | 6,799,070 | -228,846 | -3.3 | 583 | 579 | -4 | -0.7 |
| Social assistance | 1,035 | 1,038 | 3 | 0.3 | 5,433,902 | 5,369,322 | -64,580 | -1.2 | 404 | 398 | -6 | -1.5 |
| Arts, Ent., & Recreation | 594 | 511 | -83 | -14.0 | 4,167,843 | 2,023,410 | -2,144,433 | -51.5 | 540 | 305 | -235 | -43.5 |
| Accommodation & Food Services | 3,736 | 3,907 | 171 | 4.6 | 14,865,030 | 16,026,550 | 1,161,520 | 7.8 | 306 | 316 | 10 | 3.3 |
| Other Services | 1,936 | 2,123 | 187 | 9.7 | 20,366,199 | 22,375,171 | 2,008,972 | 9.9 | 809 | 811 | 2 | 0.2 |
| Total Government | 5,390 | 5,407 | 17 | 0.3 | $65,762,215 | $65,944,836 | $182,621 | 0.3 | $939 | $938 | -$1 | -0.1 |
| Federal Government | 704 | 702 | -2 | -0.3 | 11,531,372 | 11,992,085 | 460,713 | 4.0 | 1,260 | 1,314 | 54 | 4.3 |
| State Government | 733 | 732 | -1 | -0.1 | 9,720,239 | 9,754,008 | 33,769 | 0.3 | 1,020 | 1,025 | 5 | 0.5 |
| Local Government | 3,952 | 3,973 | 21 | 0.5 | 44,510,604 | 44,198,743 | -311,861 | -0.7 | 866 | 856 | -10 | -1.2 |
| Local Government Education | ND | ND | ND | ND | ND | ND | ND | ND | ND | ND | ND | ND |
| aPreliminary. | ||||||||||||
| bNorth American Industry Classification System. | ||||||||||||
| ND-Not disclosable due to confidentiality of information. | ||||||||||||
| Source: Quarterly Census of Employment and Wages, developed through a cooperative program between Research & Planning and the U.S. Bureau of Labor Statistics. | ||||||||||||
| Extract date: January 2013. | ||||||||||||
| Average Monthly Employment | Total Payroll | Average Weekly Wage | ||||||||||
|---|---|---|---|---|---|---|---|---|---|---|---|---|
| NAICSb Title | Third Quarter | Change | Third Quarter | Change | Third Quarter | Change | ||||||
| 2011 | 2012 | n | % | 2011 | 2012 | $ | % | 2011 | 2012 | $ | % | |
| Total, All Industries | 43,566 | 43,989 | 423 | 1.0 | $456,356,981 | $454,286,294 | -$2,070,687 | -0.5 | $806 | $794 | -$12 | -1.5 |
| Total Private | 30,172 | 30,691 | 519 | 1.7 | $280,182,321 | $277,780,473 | -$2,401,848 | -0.9 | $714 | $696 | -$18 | -2.5 |
| Agriculture | 294 | 320 | 26 | 8.8 | 2,154,745 | 2,374,392 | 219,647 | 10.2 | 564 | 571 | 7 | 1.2 |
| Mining | 164 | 202 | 38 | 23.2 | 2,894,754 | 3,697,523 | 802,769 | 27.7 | 1,358 | 1,408 | 50 | 3.7 |
| Utilities | 134 | 136 | 2 | 1.5 | 2,642,274 | 2,748,741 | 106,467 | 4.0 | 1,517 | 1,555 | 38 | 2.5 |
| Construction | 3,000 | 3,087 | 87 | 2.9 | 33,995,963 | 32,877,150 | -1,118,813 | -3.3 | 872 | 819 | -53 | -6.1 |
| Manufacturing | 1,486 | 1,340 | -146 | -9.8 | 26,956,346 | 18,074,802 | -8,881,544 | -32.9 | 1,395 | 1,038 | -357 | -25.6 |
| Wholesale Trade | 818 | 923 | 105 | 12.8 | 10,352,364 | 11,655,872 | 1,303,508 | 12.6 | 974 | 971 | -3 | -0.3 |
| Retail Trade | 5,352 | 5,415 | 63 | 1.2 | 36,357,706 | 35,361,790 | -995,916 | -2.7 | 523 | 502 | -21 | -4.0 |
| Transportation & Warehousing | 2,367 | 2,422 | 55 | 2.3 | 24,714,650 | 24,993,644 | 278,994 | 1.1 | 803 | 794 | -9 | -1.1 |
| Information | 1,098 | 1,145 | 47 | 4.3 | 12,903,211 | 12,272,801 | -630,410 | -4.9 | 904 | 825 | -79 | -8.7 |
| Finance & Insurance | 1,637 | 1,626 | -11 | -0.7 | 19,157,363 | 19,840,943 | 683,580 | 3.6 | 900 | 939 | 39 | 4.3 |
| Real Estate & Rental & Leasing | 529 | 562 | 33 | 6.2 | 4,646,090 | 5,098,580 | 452,490 | 9.7 | 676 | 698 | 22 | 3.3 |
| Professional & Technical Services | 1,481 | 1,445 | -36 | -2.4 | 20,266,908 | 21,592,136 | 1,325,228 | 6.5 | 1,053 | 1,149 | 96 | 9.1 |
| Mgmt. of Companies & Enterprises | 57 | 78 | 21 | 36.8 | 862,707 | 1,239,030 | 376,323 | 43.6 | 1,164 | 1,222 | 58 | 5.0 |
| Administrative & Waste Services | 1,796 | 1,763 | -33 | -1.8 | 11,338,107 | 11,233,930 | -104,177 | -0.9 | 486 | 490 | 4 | 0.8 |
| Educational Services | 221 | 239 | 18 | 8.1 | 1,452,886 | 1,542,389 | 89,503 | 6.2 | 506 | 496 | -10 | -2.0 |
| Health Care & Social Assistance | 3,941 | 3,988 | 47 | 1.2 | 41,518,156 | 41,842,321 | 324,165 | 0.8 | 810 | 807 | -3 | -0.4 |
| Ambulatory Health Care Services | 1,872 | 1,927 | 55 | 2.9 | 28,501,343 | 28,950,713 | 449,370 | 1.6 | 1,171 | 1,156 | -15 | -1.3 |
| Nursing & Residential Care Facilties | 854 | 868 | 14 | 1.6 | 6,291,614 | 6,254,162 | -37,452 | -0.6 | 567 | 554 | -13 | -2.3 |
| Hospitals & Social Assistance | 1,215 | 1,193 | -22 | -1.8 | 6,725,199 | 6,637,446 | -87,753 | -1.3 | 426 | 428 | 2 | 0.4 |
| Arts, Entertainment, & Recreation | 302 | 326 | 24 | 7.9 | 988,170 | 1,025,351 | 37,181 | 3.8 | 252 | 242 | -10 | -4.0 |
| Accommodation & Food Services | 4,250 | 4,271 | 21 | 0.5 | 17,280,337 | 17,206,756 | -73,581 | -0.4 | 313 | 310 | -3 | -1.0 |
| Other Services | 1,243 | 1,403 | 160 | 12.9 | 9,699,584 | 13,102,322 | 3,402,738 | 35.1 | 600 | 718 | 118 | 19.7 |
| Total Government | 13,394 | 13,298 | -96 | -0.7 | $176,174,660 | $176,505,821 | $331,161 | 0.2 | $1,012 | $1,021 | $9 | 0.9 |
| Federal Government | 2,681 | 2,553 | -128 | -4.8 | 42,867,893 | 41,631,625 | -1,236,268 | -2.9 | 1,230 | 1,254 | 24 | 2.0 |
| State Government | 3,978 | 3,975 | -3 | -0.1 | 57,055,255 | 57,224,961 | 169,706 | 0.3 | 1,103 | 1,107 | 4 | 0.4 |
| Local Government | 6,735 | 6,770 | 35 | 0.5 | 76,251,512 | 77,649,235 | 1,397,723 | 1.8 | 871 | 882 | 11 | 1.3 |
| Local Government Education | 3,351 | 3,299 | -52 | -1.6 | 36,715,942 | 36,424,136 | -291,806 | -0.8 | 843 | 849 | 6 | 0.8 |
| aPreliminary. | ||||||||||||
| bNorth American Industry Classification System. | ||||||||||||
| Source: Quarterly Census of Employment and Wages, developed through a cooperative program between Research & Planning and the U.S. Bureau of Labor Statistics. | ||||||||||||
| Extract date: January 2013. | ||||||||||||