Excerpted from Occasional Paper No. 7
		    
		    by: Michele Holmes, Public Relations Specialist 
		    See Related Article
		    Tables 1, 2
	        Figures 1, 2, 3, 4, 5, 6, 7


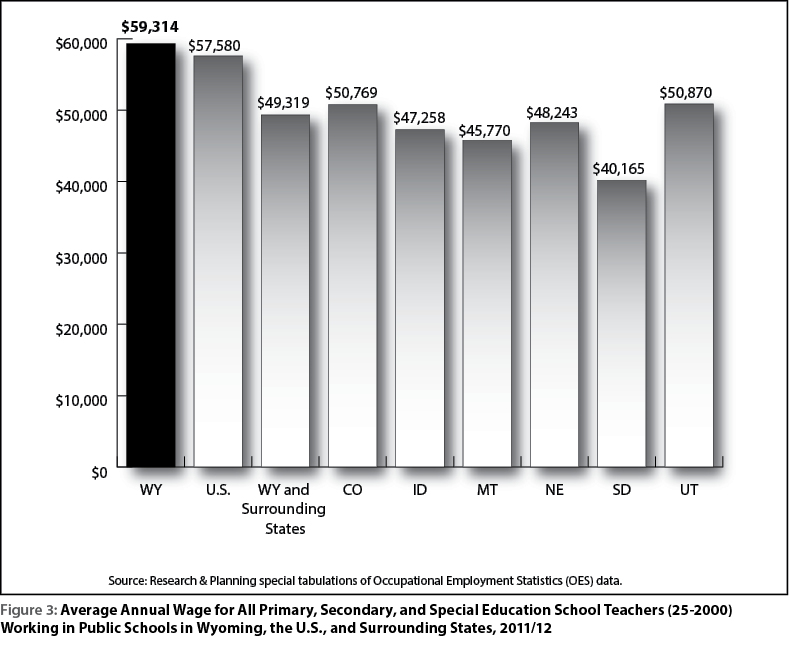
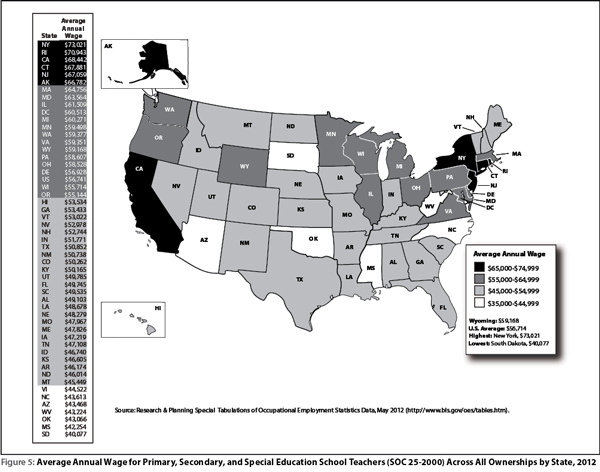
Table 1: Average Annual Wage for Specialized Teaching Occupations in Public Schools for Wyoming, Surrounding States, and the U.S., 2011/12 


						| 
							State
						 | 
						
							All Primary, Secondary, and Special Education School Teachers (25-2000)
						 | 
						
							Preschool Teachers, Except Special Education (25-2011)
						 | 
						
							Kindergarten Teachers, Except Special Education (25-2012)
						 | 
						
							Elementary School Teachers, Except Special Education (25-2021)
						 | 
						
							Middle School Teachers, Except Special and Vocational Education (25-2022)
						 | 
						
							Vocational Education Teachers, Middle School (25-2023)
						 | 
						
							Secondary School Teachers, Except Special and Vocational Education (25-2031)
						 | 
						
							Vocational Education Teachers, Secondary School (25-2032)
						 | 
						
							Special Education Teachers, Preschool, Kindergarten, and Elementary School (25-2041)
						 | 
						
							Special Education Teachers, Middle School (25-2053)
						 | 
						
							Special Education Teachers, Secondary School (25-2054)
						 | 
					
					
						| 
							WY
						 | 
						
							$59,314
						 | 
						
							$44,420
						 | 
						
							$54,850
						 | 
						
							$58,690
						 | 
						
							$61,400
						 | 
						
							n/d
						 | 
						
							$60,480
						 | 
						
							$59,890
						 | 
						
							$57,620
						 | 
						
							$62,690
						 | 
						
							$57,760
						 | 
					
					
						| 
							U.S.
						 | 
						
							$57,580
						 | 
						
							$48,860
						 | 
						
							$55,590
						 | 
						
							$57,290
						 | 
						
							$56,930
						 | 
						
							$56,550
						 | 
						
							$58,540
						 | 
						
							$57,180
						 | 
						
							$57,392
						 | 
						
							$59,940
						 | 
						
							$60,627
						 | 
					
					
						| 
							Region
						 | 
						
							$49,319
						 | 
						
							$42,018
						 | 
						
							$46,439
						 | 
						
							$49,453
						 | 
						
							$49,758
						 | 
						
							$49,409
						 | 
						
							$49,778
						 | 
						
							$50,457
						 | 
						
							$48,976
						 | 
						
							$49,540
						 | 
						
							$50,680
						 | 
					
					
						| 
							CO
						 | 
						
							$50,769
						 | 
						
							$46,950
						 | 
						
							$48,480
						 | 
						
							$50,490
						 | 
						
							$49,930
						 | 
						
							n/d
						 | 
						
							$51,800
						 | 
						
							$53,620
						 | 
						
							$51,750
						 | 
						
							$51,990
						 | 
						
							n/d
						 | 
					
					
						| 
							ID
						 | 
						
							$47,258
						 | 
						
							$41,550
						 | 
						
							$43,000
						 | 
						
							$48,770
						 | 
						
							$48,410
						 | 
						
							n/d
						 | 
						
							$46,420
						 | 
						
							$45,490
						 | 
						
							n/d
						 | 
						
							$49,740
						 | 
						
							n/d
						 | 
					
					
						| 
							MT
						 | 
						
							$45,770
						 | 
						
							$26,210
						 | 
						
							$43,300
						 | 
						
							$46,620
						 | 
						
							$45,730
						 | 
						
							n/d
						 | 
						
							$47,880
						 | 
						
							$47,570
						 | 
						
							n/d
						 | 
						
							$45,420
						 | 
						
							n/d
						 | 
					
					
						| 
							NE
						 | 
						
							$48,243
						 | 
						
							$41,190
						 | 
						
							$46,550
						 | 
						
							$47,720
						 | 
						
							$49,590
						 | 
						
							n/d
						 | 
						
							$48,490
						 | 
						
							$51,030
						 | 
						
							$46,347
						 | 
						
							$48,920
						 | 
						
							n/d
						 | 
					
					
						| 
							SD
						 | 
						
							$40,165
						 | 
						
							$35,210
						 | 
						
							$39,030
						 | 
						
							$40,160
						 | 
						
							$40,470
						 | 
						
							n/d
						 | 
						
							$40,490
						 | 
						
							$42,090
						 | 
						
							n/d
						 | 
						
							$40,510
						 | 
						
							$40,710
						 | 
					
					
						| 
							UT
						 | 
						
							$50,870
						 | 
						
							$33,610
						 | 
						
							$40,250
						 | 
						
							$50,950
						 | 
						
							$53,320
						 | 
						
							n/d
						 | 
						
							$51,650
						 | 
						
							$50,550
						 | 
						
							n/d
						 | 
						
							$41,730
						 | 
						
							n/d
						 | 
					
					
						|  
							
				       | 
					
					
						| 
							Source: Research & Planning special tabulations of Occupational Employment Statistics (OES) data. 
						 | 
					
					
						| 
							Region = Wyoming and surrounding states. 
						 | 
					
					
						| 
							n/d = Not discloseable due to confidentiality. 
						 | 


			Table 2: Estimated Employment and Average Annual Wages for All Primary, Secondary, and Special Education School Teachers (SOC 25-2000) by Location and Ownership, 2011/12 School Year 


						| 
							
						 | 
						
							Local Public Schools
						 | 
						
							Private Sector
						 | 
						
						Total, All Ownershipsa | 
					
					
						| 
							
						 | 
						
							Employment
						 | 
						
							Average Annual Wage
						 | 
						
							Employment
						 | 
						
							Average Annual Wage
						 | 
						
							Employment
						 | 
						
							Average Annual Wage
						 | 
					
					
						| 
							
						 | 
						
							
						 | 
						
						  
					     | 
						
						  
					     | 
						
						  
					     | 
						
						  
					     | 
						
						  
					     | 
						
						Differenceb  | 
						
						  
					     | 
						
						  
					     | 
						
						  
					     | 
						
						Differenceb  | 
					
					
						| 
							State
						 | 
						
							N
						 | 
						
							Row %
						 | 
						
							$
						 | 
						
							N
						 | 
						
							Row %
						 | 
						
							$
						 | 
						
							$
						 | 
						
							%
						 | 
						
							N
						 | 
						
							Row %
						 | 
						
							$
						 | 
						
							$
						 | 
						
							%
						 | 
					
					
						| 
							Wyoming
						 | 
						
							7,527
						 | 
						
							90.6%
						 | 
						
							$59,314 
						 | 
						
							667
						 | 
						
							8.0%
						 | 
						
							$34,295 
						 | 
						
							-$25,019
						 | 
						
							-42.2%
						 | 
						
							8,308
						 | 
						
							100.0%
						 | 
						
							$56,940 
						 | 
						
							-$2,374
						 | 
						
							-4.0%
						 | 
					
					
						| 
							U.S.
						 | 
						
							3,334,130
						 | 
						
							82.7%
						 | 
						
							$57,580 
						 | 
						
							653,830
						 | 
						
							16.2%
						 | 
						
							$39,233 
						 | 
						
							-$18,347
						 | 
						
							-31.9%
						 | 
						
							4,033,290
						 | 
						
							100.0%
						 | 
						
							$54,545 
						 | 
						
							-$3,035
						 | 
						
							-5.3%
						 | 
					
					
						| 
							WY & Surrounding States
						 | 
						
							158,020
						 | 
						
							88.4%
						 | 
						
							$49,396 
						 | 
						
							18,977
						 | 
						
							10.6%
						 | 
						
							$33,294 
						 | 
						
							-$16,102
						 | 
						
							-32.6%
						 | 
						
							178,816
						 | 
						
							100.0%
						 | 
						
							$47,590 
						 | 
						
							-$1,806
						 | 
						
							-3.7%
						 | 
					
					
						| 
							Colorado
						 | 
						
							62,864
						 | 
						
							88.1%
						 | 
						
							$50,841 
						 | 
						
							7,996
						 | 
						
							11.2%
						 | 
						
							$32,532 
						 | 
						
							-$18,309
						 | 
						
							-36.0%
						 | 
						
							71,365
						 | 
						
							100.0%
						 | 
						
							$48,685 
						 | 
						
							-$2,156
						 | 
						
							-4.2%
						 | 
					
					
						| 
							Idaho
						 | 
						
							14,610
						 | 
						
							89.4%
						 | 
						
							$47,323 
						 | 
						
							1,650
						 | 
						
							10.1%
						 | 
						
							$31,884 
						 | 
						
							-$15,439
						 | 
						
							-32.6%
						 | 
						
							16,342
						 | 
						
							100.0%
						 | 
						
							$45,679 
						 | 
						
							-$1,644
						 | 
						
							-3.5%
						 | 
					
					
						| 
							Montana
						 | 
						
							11,779
						 | 
						
							84.4%
						 | 
						
							$46,048 
						 | 
						
							1,837
						 | 
						
							13.2%
						 | 
						
							$30,931 
						 | 
						
							-$15,117
						 | 
						
							-32.8%
						 | 
						
							13,953
						 | 
						
							100.0%
						 | 
						
							$43,781 
						 | 
						
							-$2,267
						 | 
						
							-4.9%
						 | 
					
					
						| 
							Nebraska
						 | 
						
							24,145
						 | 
						
							94.5%
						 | 
						
							$48,102 
						 | 
						
							1,111
						 | 
						
							4.3%
						 | 
						
							$32,866 
						 | 
						
							-$15,236
						 | 
						
							-31.7%
						 | 
						
							25,547
						 | 
						
							100.0%
						 | 
						
							$47,585 
						 | 
						
							-$517
						 | 
						
							-1.1%
						 | 
					
					
						| 
							South Dakota
						 | 
						
							11,399
						 | 
						
							90.1%
						 | 
						
							$40,229 
						 | 
						
							1,020
						 | 
						
							8.1%
						 | 
						
							$29,090 
						 | 
						
							-$11,139
						 | 
						
							-27.7%
						 | 
						
							12,645
						 | 
						
							100.0%
						 | 
						
							$39,287 
						 | 
						
							-$942
						 | 
						
							-2.3%
						 | 
					
					
						| 
							Utah
						 | 
						
							25,696
						 | 
						
							83.8%
						 | 
						
							$50,955 
						 | 
						
							4,696
						 | 
						
							15.3%
						 | 
						
							$36,848 
						 | 
						
							-$14,107
						 | 
						
							-27.7%
						 | 
						
							30,656
						 | 
						
							100.0%
						 | 
						
							$48,687 
						 | 
						
							-$2,268
						 | 
						
							-4.5%
						 | 
					
					
						|  
							
				       | 
					
					
						| 
						aTotal = Sum of federal, state, local (public) schools, and private sector. Federal and state estimates are not presented in this table but are available in Tables 1-4 at http://doe.state.wy.us/lmi/education_costs.htm.  | 
					
					
						| bDifference = Compared to average annual wage for local public schools.  | 
					
					
						| 
							Source: Research & Planning (R&P) special tabulations of Occupational Employment Statistics (OES) data. 
						 | 


			