© Copyright 2007 by the Wyoming Department of Employment, Research & Planning
Vol. 44 No. 4
In a short two-year period the overall working population in Wyoming increased, but the growth did not occur in the resident population. The number of women residents actually decreased, while the number of resident males increased only slightly. The number of nonresidents increased by more than half, indicating that almost all of the new labor market growth in the state was nonresident labor. Additionally, updated wage data indicate menĺs wages are rising more quickly than womenĺs wages.
A common theme in recent Wyoming Labor Market articles is the energy industryĺs effect on the economy. The expansion has influenced wages and living costs as well as population growth in the state. In fact, there are few areas of life in Wyoming that remain unaffected by the expansion. It is still unclear, however, whether the effects are universal or if some segments of the labor force are more affected than others. As part of that ongoing question, the Research & Planning (R&P) section of the Department of Employment has recently released the updated Earnings by Age, Gender, and Industry tables (http://doe.state.wy.us/lmi/wfdemog/toc3.htm).
One of the most striking data observations is the change in demographics (see Table 1) which represents an enumeration of all persons who worked at any time in a Wyoming Unemployment Insurance (UI) covered job. In a short two-year period, 2004-2006, the overall working population in Wyoming increased by 27,094, or 8.3%. This is in line with other economic indicators such as the Current Employment Statistics estimate (Bullard, 2007) which indicated job growth of 8.3% from 2004 to 2006. At the same time, the unemployment rate dropped significantly and has remained at historic lows (Azar, 2007). However, this growth did not occur in the resident population. For a full discussion of residency determination, see Jones, 2004. The number of women residents actually decreased by 1,180 (-0.9%) over the two-year period while the number of resident men increased by only 455 (0.3%). Meanwhile, the number of nonresidents increased by 27,819 (57.0%), indicating that almost all of the new labor market growth in the state was nonresident labor (see Figure 1). In 2004, nonresidents made up 15.0% of the working population in the state. In 2006, that percentage was 21.8%.
Another important demographic change is the universal decrease in the number of residents under age 45. The largest declines were in those under age 20 (-7.3%) and in those age 20-24 (-7.1%). The trends were similar for women and men separately. Alternatively, the number of residents in the older age groups increased substantially. The 55- to 64-year-old age group increased by 4,496 (13.8%) and the over-65 group increased by 1,232 (12.8%).
Because much of the growth is driven by the Natural Resources & Mining sector, Table 2 shows the demographic changes from 2004 to 2006 for the industry. Overall, employment grew by 30.2% (9,185) over the two-year period. Almost 60% (5,490) of new workers were nonresidents. In fact, the number of nonresidents in the industry grew by 118.9%. They comprised 15.2% of employment in 2004 and 25.5% of employment in 2006. Additionally, the number of women increased by 20.1% (637), while the number of men increased by 13.5% (3,058). It is important to note that the number of residents, both male and female, who started working in Natural Resources & Mining is greater than the total number of new residents who began working in the state during the same period. This reflects a pattern of job movement among Wyoming residents. People are moving from other industries within the state into the higher paying Natural Resources & Mining positions. By examining the series of industry tables available online, it is apparent that jobs worked by residents declined by the largest magnitude in Leisure & Hospitality, Education Services, and Retail Trade, likely indicating resident workers moved from these industries into positions created by the energy expansion.
The next observation from the data tables is the change in wages. Table 3 shows the average annual pay per person regardless of full- or part-time status, amount of overtime, or number of jobs worked throughout the year. There is one record per person per year which reflects the total wages paid by all establishments covered by Unemployment Insurance (UI). Employers covered by UI are required to report employment and pay for each job filled by a worker during a given quarter. Overall, wages increased from 2004 to 2006 by 16.3% ($3,702). Menĺs wages increased by $6,580 (20.7%), while womenĺs wages increased by $2,973 (16.3%; see Figure 2, page 6). Again, nonresidents had the most dramatic change with an increase of 60.9%.
The same trends were mirrored in the Natural Resources & Mining sector (see Table 4). Overall average annual wages increased by 14.2% ($5,800). Wages for women increased by 17.5%, wages for men increased by 19.4%, and wages for nonresidents increased by 70.8%.
For most of the years prior to the current energy expansions (1994-2003), growth in average annual wages for women outpaced that of men (see Table 5). However, starting in 2004, the trend reversed and menĺs wages started growing more quickly than womenĺs wages. The same trend can be seen in womenĺs earnings as a percent of menĺs earnings. From the low in 1994, the percentage increased steadily over time until 2004, at which time it started to decline again.
The gender wage gap can be explained in part by unusually high pay for men. It is possible that the womenĺs average annual wage of $21,217, while low in comparison to the $38,393 earned by men in 2006, was actually similar to average wages for women in the region or nation. To find out, we turned to the Highlights of Womenĺs Earnings in the 2005 report (U.S. Department of Labor, Bureau of Labor Statistics, 2006). The data in this case are derived from the Current Population Survey (CPS), conducted monthly for the Bureau of Labor Statistics by the U.S. Census Bureau using a national sample of about 60,000 households. Wages reflect those for full-time employment only. Using Table 3 from the report, we ranked all of the states on Median Weekly Earnings for Men (1 is the highest). We then ranked the states again by Median Weekly Earnings for Women and then again by Womenĺs Earnings as a Percent of Menĺs (see Table 6 and Figure 3). As it turns out, Wyoming womenĺs wages are ranked 48th among the states while menĺs wages are ranked 15th. However, while still at the lower end of the range, Wyoming womenĺs wages are not that different from those in the surrounding states. Montana actually ranked lower than Wyoming on womenĺs wages with a median of $477 per week and South Dakota was only slightly higher at $493 per week. Not counting Colorado, the highest median weekly wage for women in a border state was Nebraska with $536 (a difference of only $55).
More interestingly, the states on the edges of the wage disparity distribution are those with the largest difference in menĺs wages ranking versus womenĺs wages ranking. Those with the largest wage disparity (Wyoming, Wisconsin, Utah, and Idaho) have wages for men ranked considerably higher than wages for women. Alternatively, the states with the smallest wage disparity (with one exception) are the states with the largest difference in ranking where the womenĺs earnings are ranked higher than the menĺs.
While causes and potential solutions for wage disparity are beyond the scope of this article, it can be noted that the energy expansion in Wyoming is indeed affecting womenĺs wages as a percentage of menĺs wages. The industries most affected by the expansion are primarily comprised of men. Wages in the growing industries are rising; therefore, wages for men are subsequently rising more quickly than wages for women as a whole.
References
Azar, R. (2007). Local area unemployment statistics. Retrieved May 31, 2007, from http://doe.state.wy.us/lmi/LAUS/TOC.HTM
Bullard, D. (2007). Current employment statistics: Monthly estimates of nonagricultural wage and salary employment for Wyoming, Laramie County and Natrona County by industry. Retrieved May 31, 2007, from http://doe.state.wy.us/lmi/CES/TOC.HTM
Jones, S. D. (2004). Worker residency determination, Wyoming stepwise procedure. Wyoming Labor Force Trends 41(8). Retrieved May 31, 2007, from http://doe.state.wy.us/LMI/0804/a1supp.htm
U.S. Department of Labor, Bureau of Labor Statistics (2006). Highlights of womenĺs earnings in 2005. Retrieved May 31, 2007, from http://www.bls.gov/cps/cpswom2005.pdf
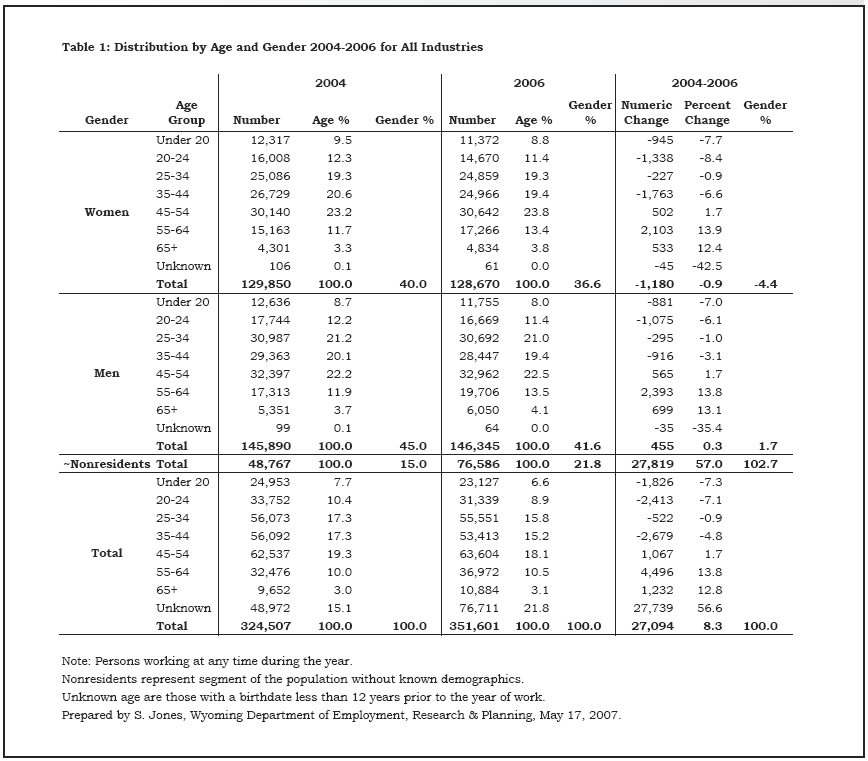
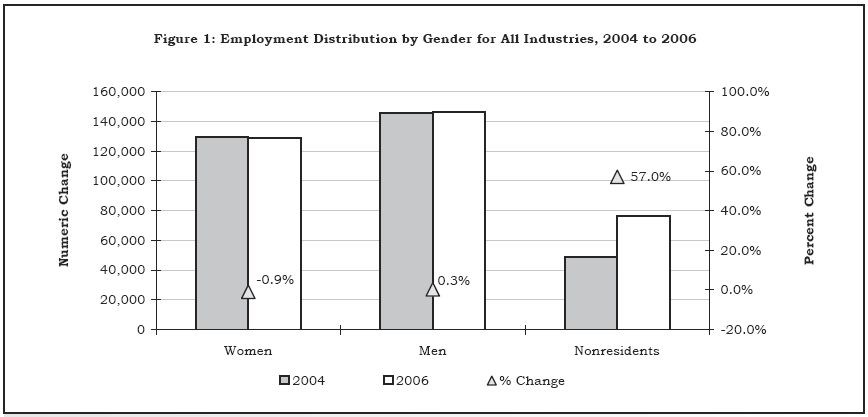
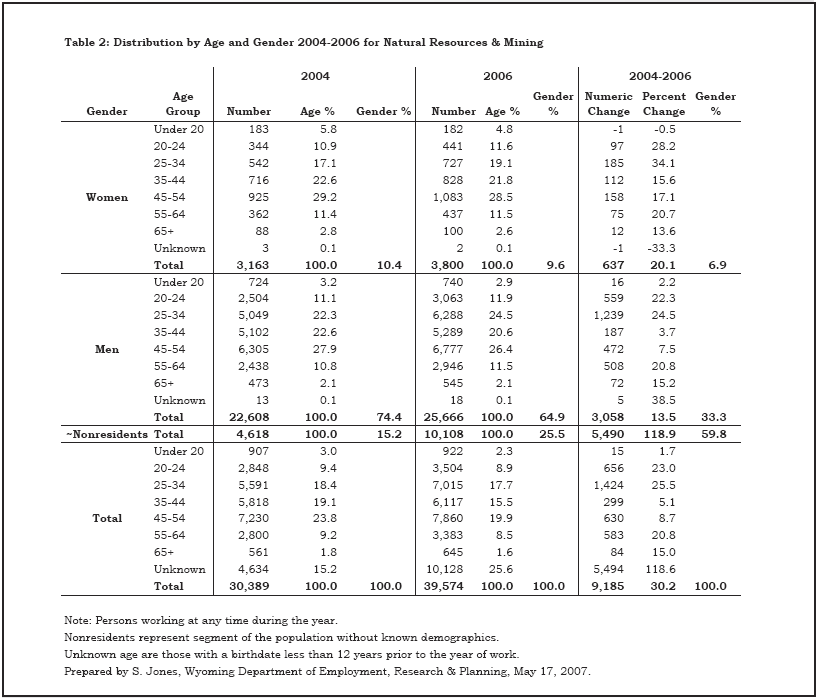
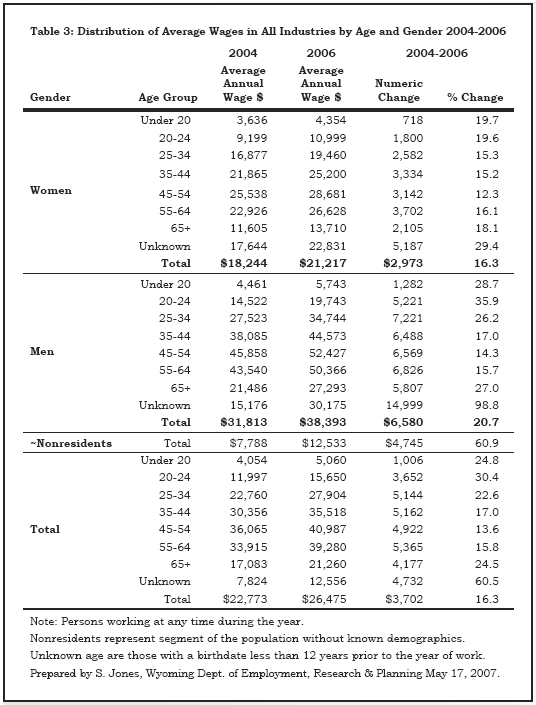
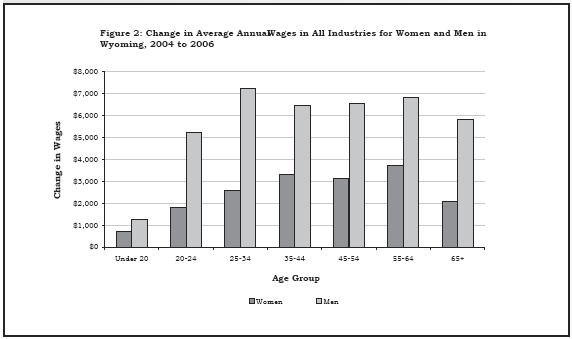
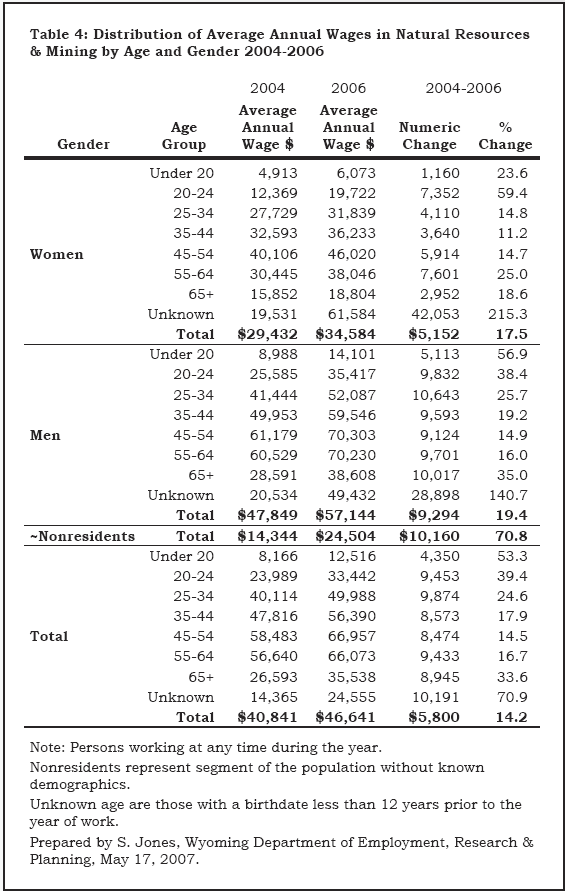
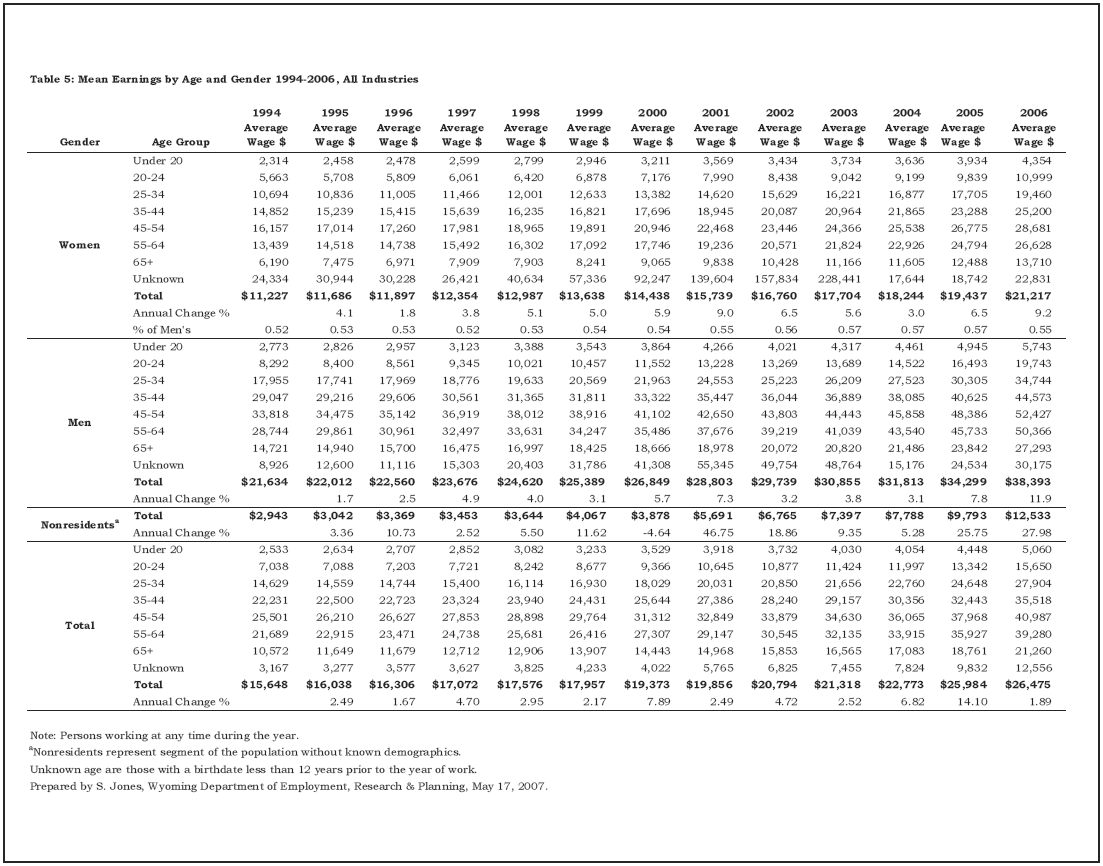
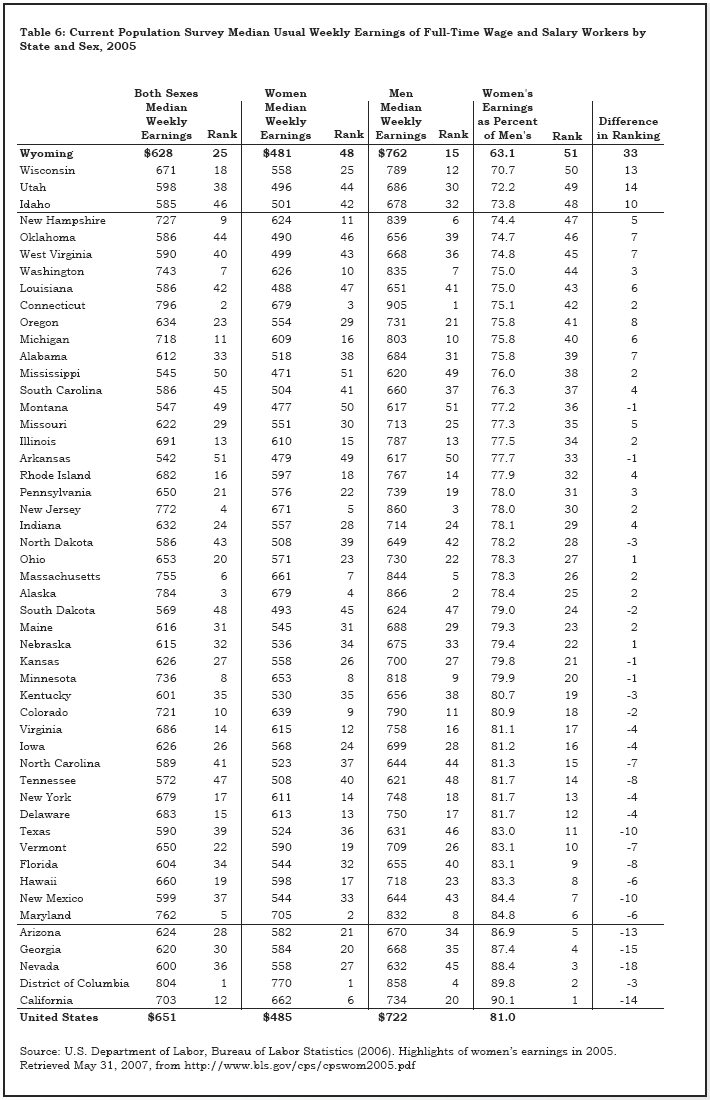
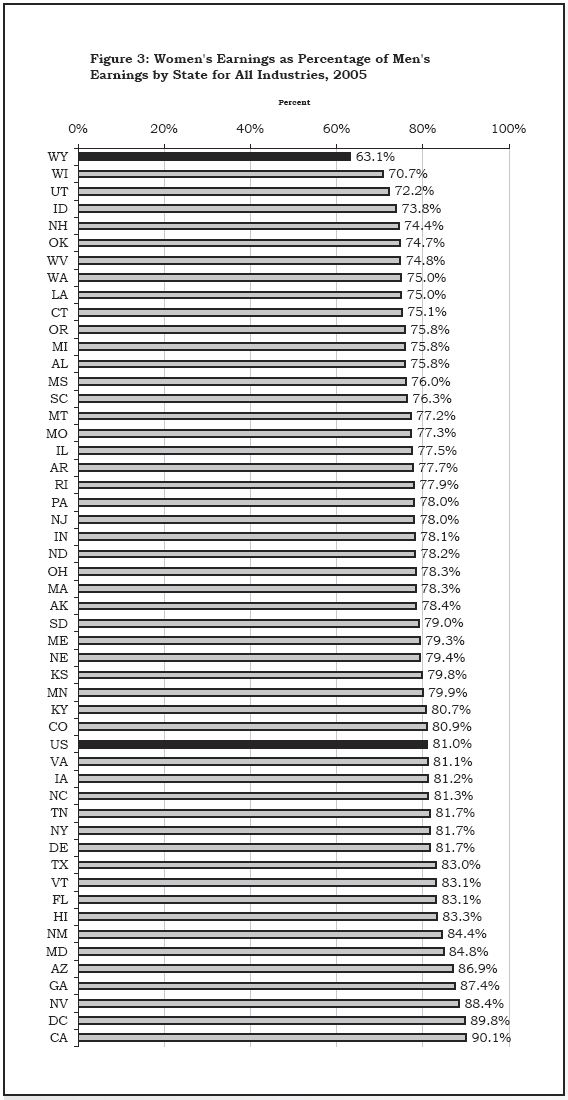
Table of Contents | Labor Market Information | Wyoming
at Work | Send Us Mail
Last modified on
by Phil Ellsworth.